- Home >
- Stock Photos >
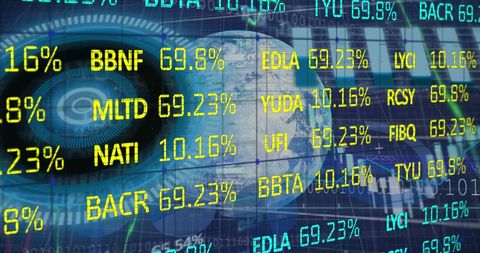
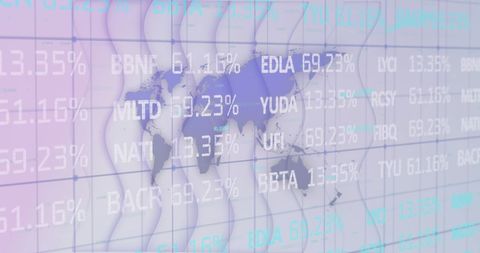
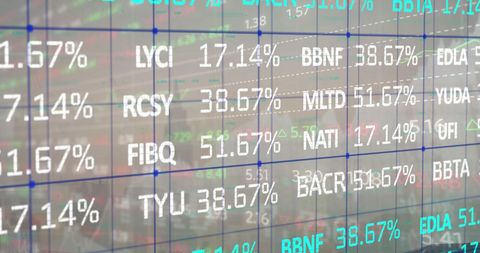
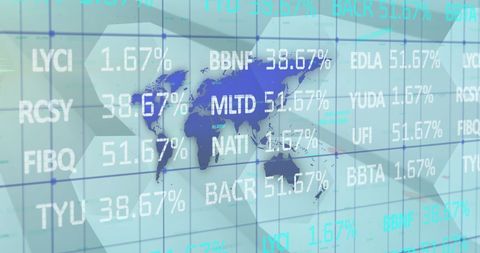
- Global Stock Market Data Visualization with Tech Interface
Global Stock Market Data Visualization with Tech Interface Image

Visualization shows dynamic stock market data with floating graphics. Represents global business operations and economic analysis through digital interface, useful for finance presentations, tech advertisements, or educational resources on market trends.

downloads
Tags:
More
Credit Photo
If you would like to credit the Photo, here are some ways you can do so
Text Link
photo Link
<span class="text-link">
<span>
<a target="_blank" href=https://pikwizard.com/photo/global-stock-market-data-visualization-with-tech-interface/b01898f583331b57aa2bbcd3ce6cf2df/>PikWizard</a>
</span>
</span>
<span class="image-link">
<span
style="margin: 0 0 20px 0; display: inline-block; vertical-align: middle; width: 100%;"
>
<a
target="_blank"
href="https://pikwizard.com/photo/global-stock-market-data-visualization-with-tech-interface/b01898f583331b57aa2bbcd3ce6cf2df/"
style="text-decoration: none; font-size: 10px; margin: 0;"
>
<img src="https://pikwizard.com/pw/medium/b01898f583331b57aa2bbcd3ce6cf2df.jpg" style="margin: 0; width: 100%;" alt="" />
<p style="font-size: 12px; margin: 0;">PikWizard</p>
</a>
</span>
</span>
Free (free of charge)
Free for personal and commercial use.
Author: Creative Art