- Home >
- Stock Photos >
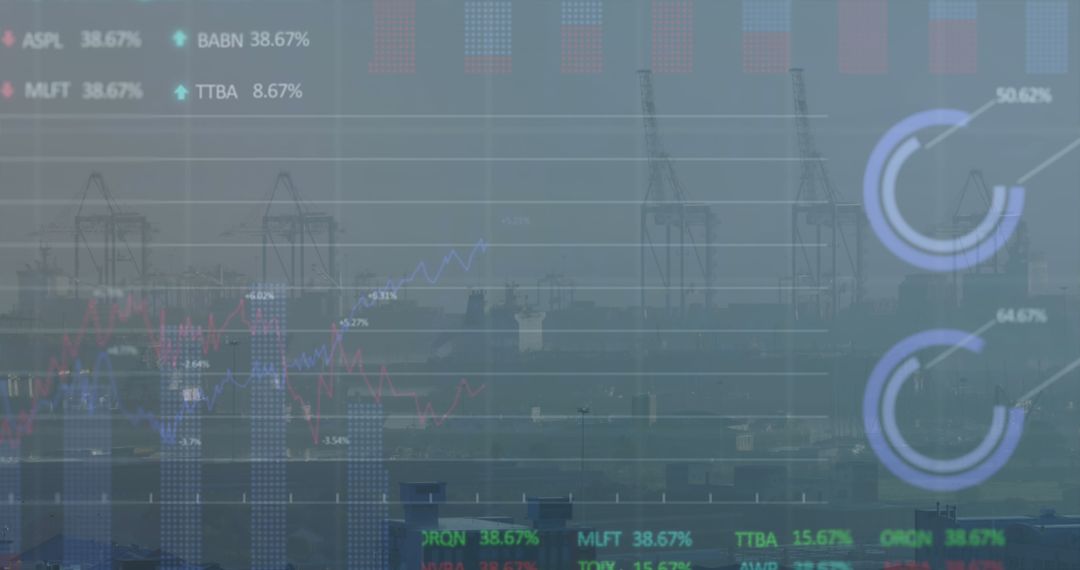
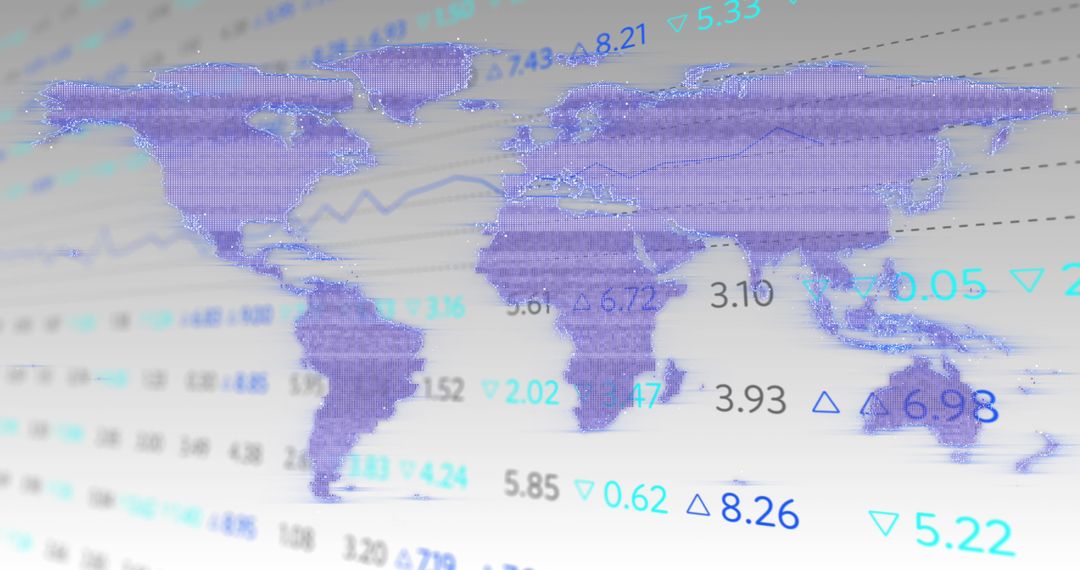
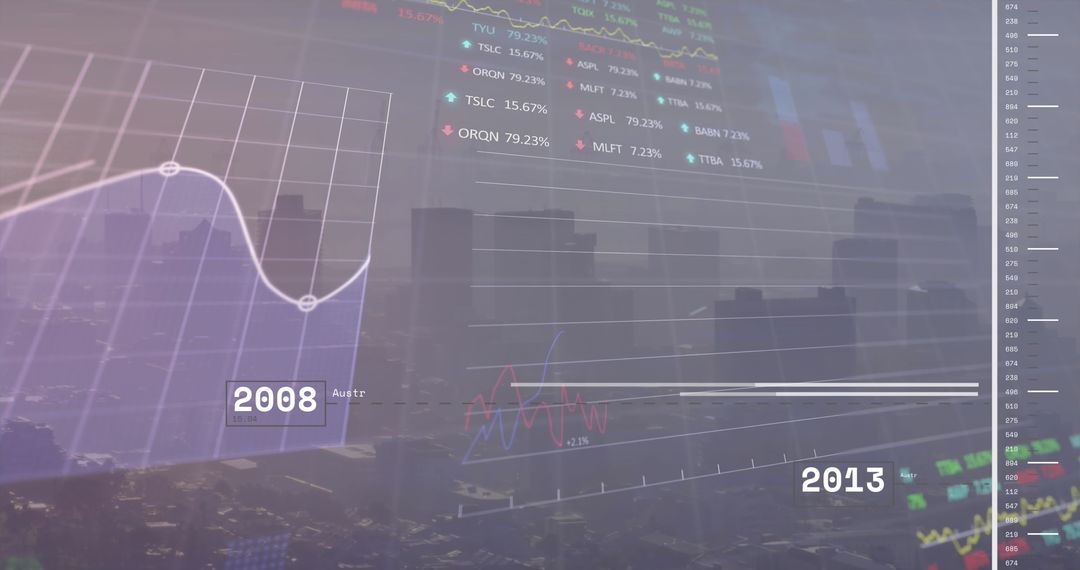
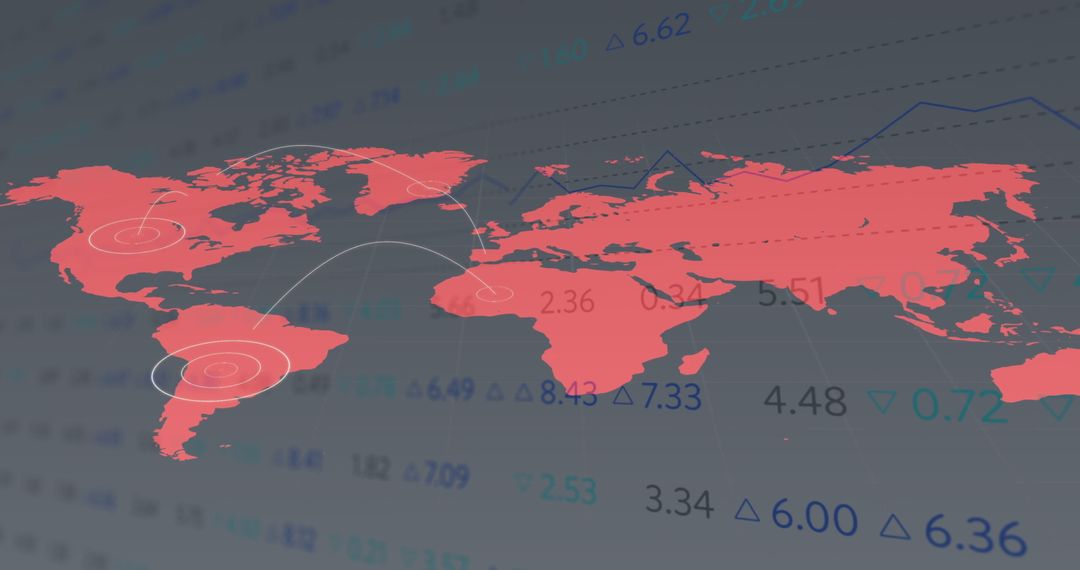
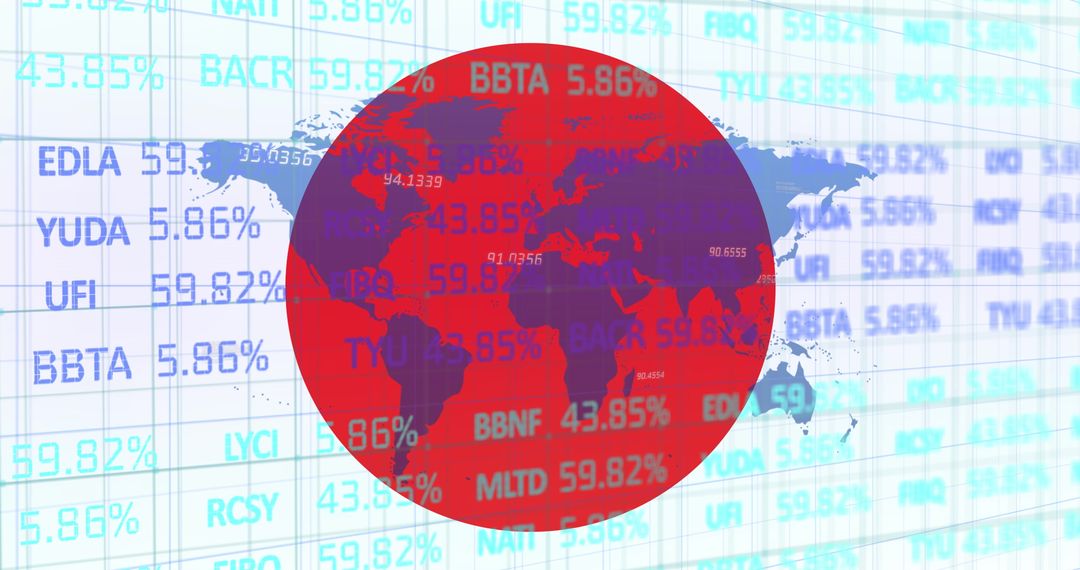
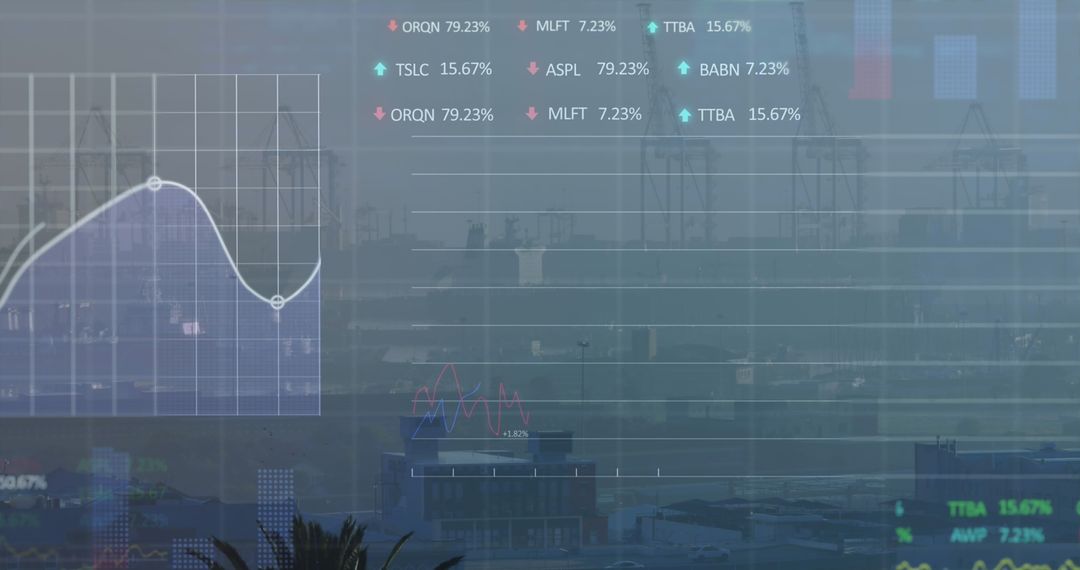
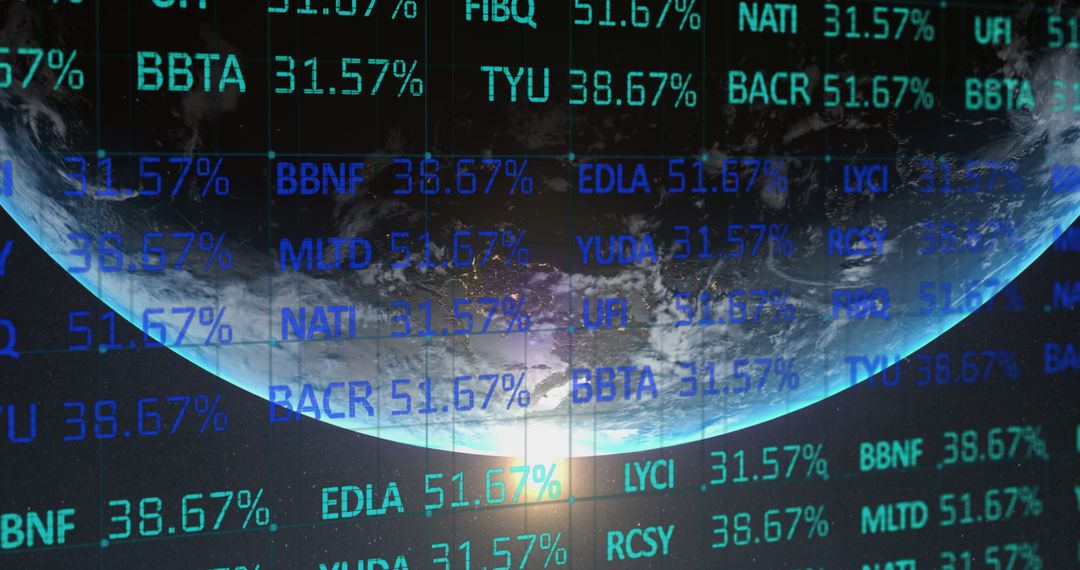
- Global Stock Market Data with Overlaid Analytics
Global Stock Market Data with Overlaid Analytics Image

Abstract representation of financial data trends displayed over a globe. Suitable for business and finance presentations, articles relating to global economic conditions, or digital marketing for financial tech. Useful for illustrating economic forecasts, international stock market behaviors, or financial technology innovations.
Powered by 


2
downloads
downloads
Tags:
More
Credit Photo
If you would like to credit the Photo, here are some ways you can do so
Text Link
photo Link
<span class="text-link">
<span>
<a target="_blank" href=https://pikwizard.com/photo/global-stock-market-data-with-overlaid-analytics/8ed364a4780d992172637d49e55df7e9/>PikWizard</a>
</span>
</span>
<span class="image-link">
<span
style="margin: 0 0 20px 0; display: inline-block; vertical-align: middle; width: 100%;"
>
<a
target="_blank"
href="https://pikwizard.com/photo/global-stock-market-data-with-overlaid-analytics/8ed364a4780d992172637d49e55df7e9/"
style="text-decoration: none; font-size: 10px; margin: 0;"
>
<img src="https://pikwizard.com/pw/medium/8ed364a4780d992172637d49e55df7e9.jpg" style="margin: 0; width: 100%;" alt="" />
<p style="font-size: 12px; margin: 0;">PikWizard</p>
</a>
</span>
</span>
Free (free of charge)
Free for personal and commercial use.
Author: Creative Art
Similar Free Stock Images

Premium


Premium


Premium


Premium


Premium


Premium


Premium


Premium


Premium


Premium


Premium


Premium


Premium


Premium


Premium


Premium


Premium


Premium


Premium


Premium


Premium


Premium


Premium


Premium