
- Home >
- Stock Photos >
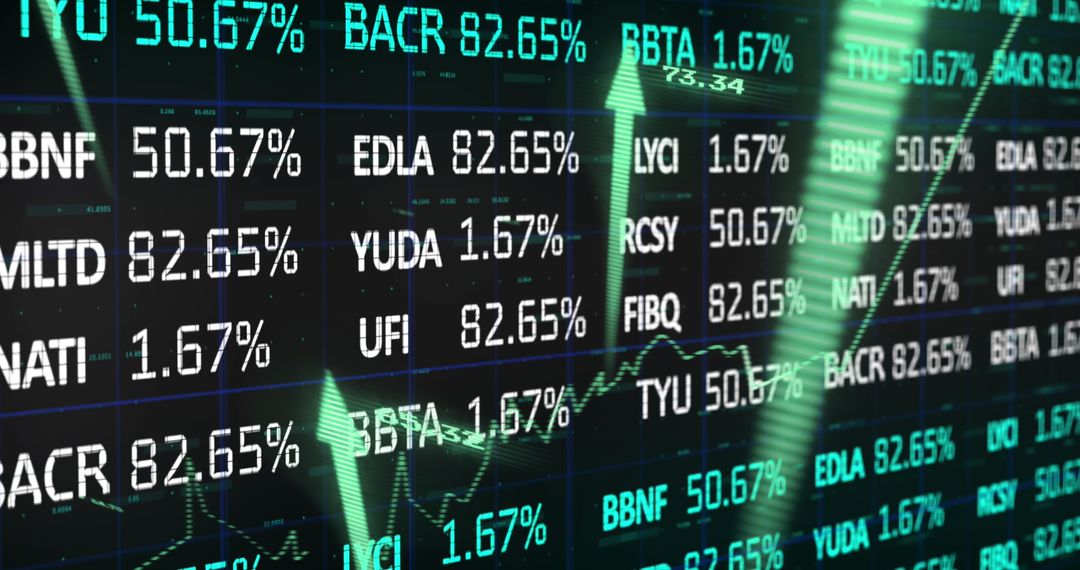
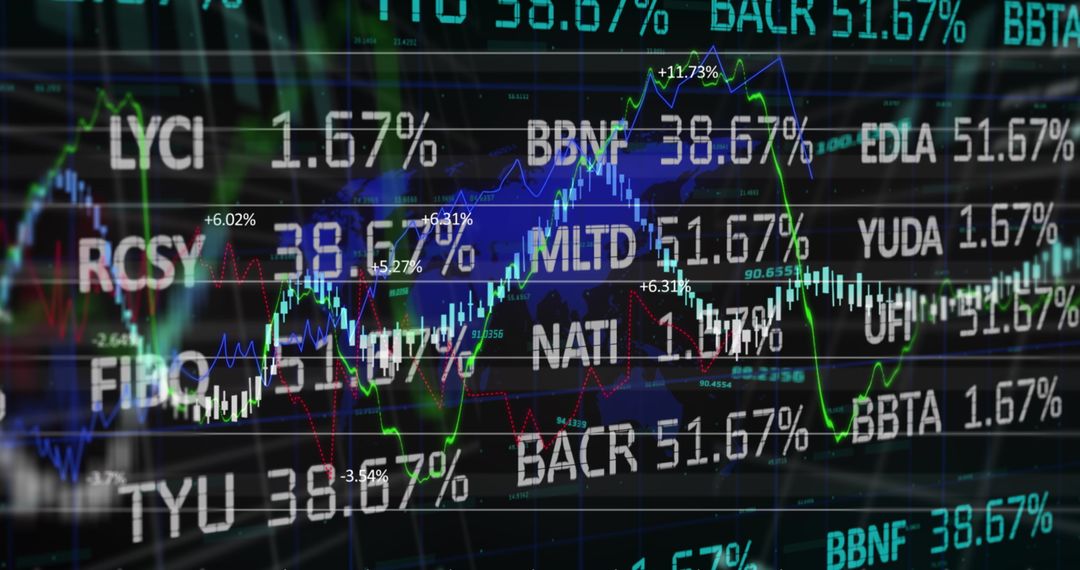
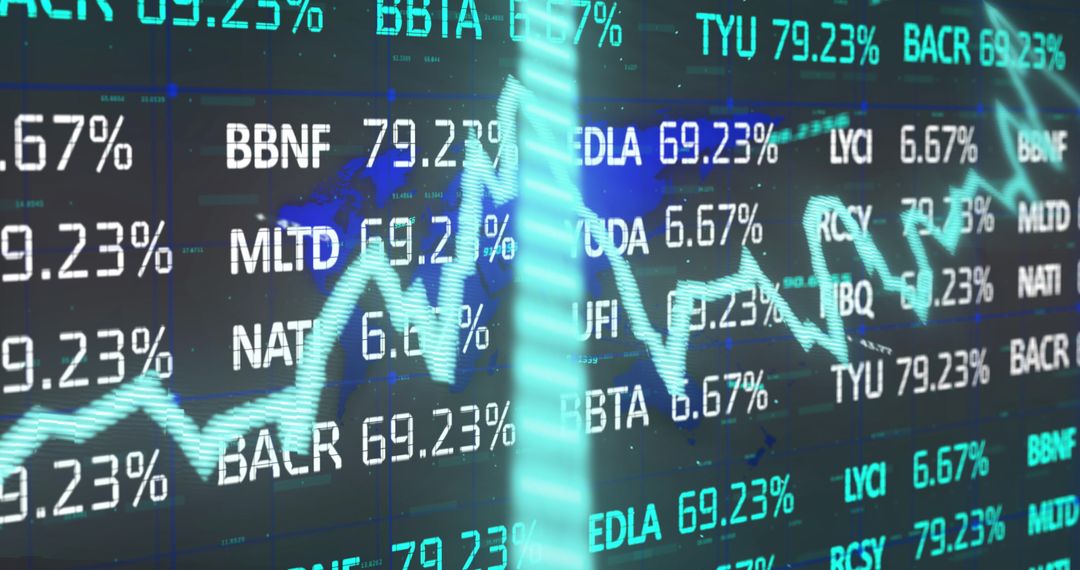
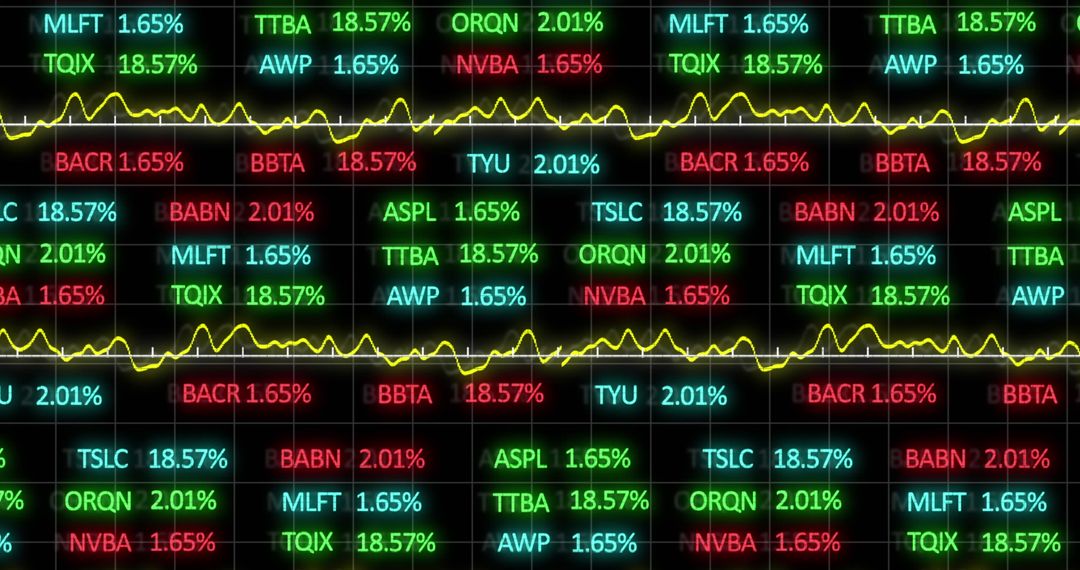
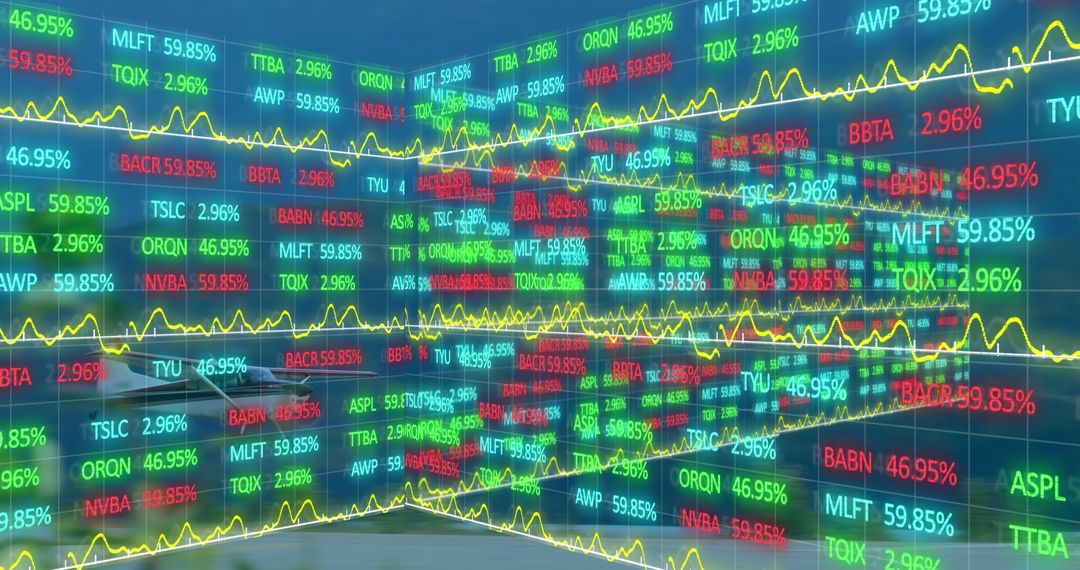
- Global Stock Market Display with Finance Chart and World Map
Global Stock Market Display with Finance Chart and World Map Image

Dynamic scene features fluctuations in stock prices represented as a graph overlaying a world map, symbolizing global economic activity and trade. Useful for presentations on global finance trends, investment analysis, economic studies, or technology-focused businesses.
Powered by  - Get 15% off with code: PIKWIZARD15


4
downloads
downloads
Tags:
More
Credit Photo
If you would like to credit the Photo, here are some ways you can do so
Text Link
photo Link
<span class="text-link">
<span>
<a target="_blank" href=https://pikwizard.com/photo/global-stock-market-display-with-finance-chart-and-world-map/377bbaf1d3380cc6058bc01442e4c440/>PikWizard</a>
</span>
</span>
<span class="image-link">
<span
style="margin: 0 0 20px 0; display: inline-block; vertical-align: middle; width: 100%;"
>
<a
target="_blank"
href="https://pikwizard.com/photo/global-stock-market-display-with-finance-chart-and-world-map/377bbaf1d3380cc6058bc01442e4c440/"
style="text-decoration: none; font-size: 10px; margin: 0;"
>
<img src="https://pikwizard.com/pw/medium/377bbaf1d3380cc6058bc01442e4c440.jpg" style="margin: 0; width: 100%;" alt="" />
<p style="font-size: 12px; margin: 0;">PikWizard</p>
</a>
</span>
</span>
Free (free of charge)
Free for personal and commercial use.
Author: Awesome Content
Similar Free Stock Images

Premium


Premium


Premium


Premium


Premium


Premium


Premium


Premium


Premium


Premium


Premium


Premium


Premium


Premium


Premium


Premium


Premium


Premium


Premium


Premium


Premium


Premium


Premium


Premium


Premium

