- Home >
- Stock Photos >
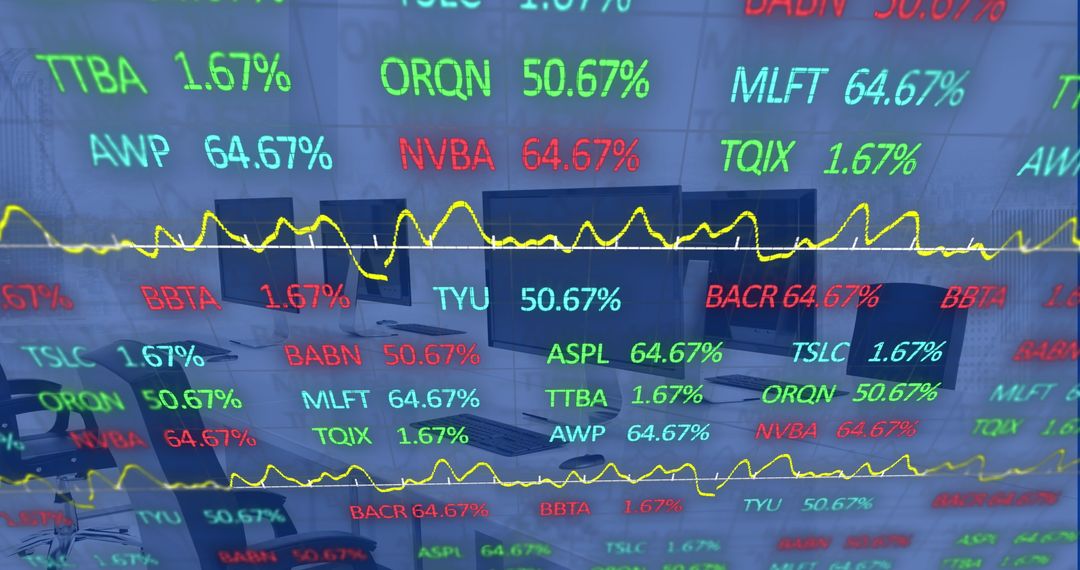
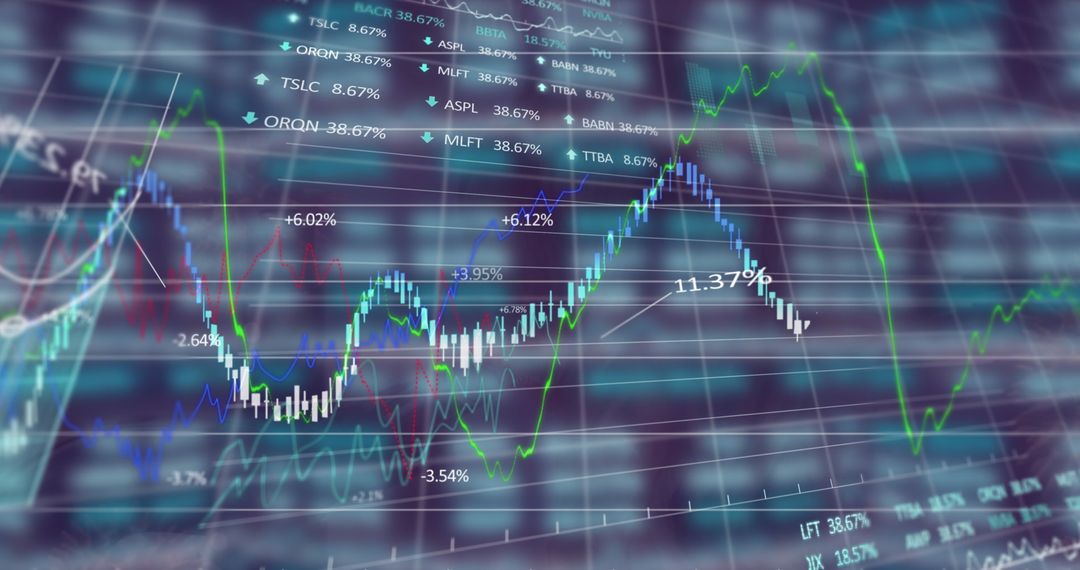
- Global Stock Market Graphs with Virtual Data Overlays
Global Stock Market Graphs with Virtual Data Overlays Image

Dynamic display of colorful stock market graphs and virtual data overlays, symbolizing the complex world of global economics and financial analysis. Useful for presentations on economic trends, business reports, financial technology insights, and investment strategies.
Powered by  - Get 15% off with code: PIKWIZARD15


2
downloads
downloads
Tags:
More
Credit Photo
If you would like to credit the Photo, here are some ways you can do so
Text Link
photo Link
<span class="text-link">
<span>
<a target="_blank" href=https://pikwizard.com/photo/global-stock-market-graphs-with-virtual-data-overlays/451e617d68057610e42a969e331e387e/>PikWizard</a>
</span>
</span>
<span class="image-link">
<span
style="margin: 0 0 20px 0; display: inline-block; vertical-align: middle; width: 100%;"
>
<a
target="_blank"
href="https://pikwizard.com/photo/global-stock-market-graphs-with-virtual-data-overlays/451e617d68057610e42a969e331e387e/"
style="text-decoration: none; font-size: 10px; margin: 0;"
>
<img src="https://pikwizard.com/pw/medium/451e617d68057610e42a969e331e387e.jpg" style="margin: 0; width: 100%;" alt="" />
<p style="font-size: 12px; margin: 0;">PikWizard</p>
</a>
</span>
</span>
Free (free of charge)
Free for personal and commercial use.
Author: Authentic Images
Similar Free Stock Images

Premium


Premium


Premium


Premium


Premium


Premium


Premium


Premium


Premium


Premium


Premium


Premium


Premium


Premium


Premium


Premium


Premium


Premium


Premium


Premium


Premium


Premium


Premium


Premium