- Home >
- Stock Photos >
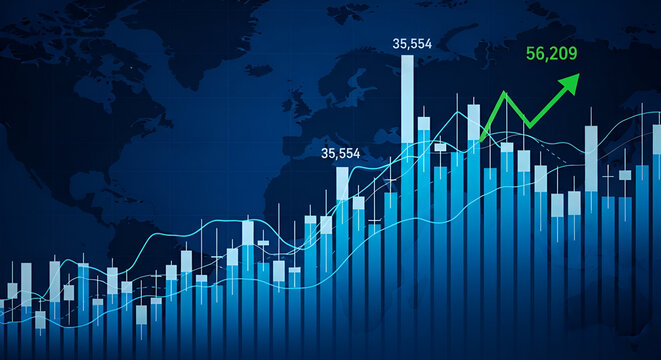
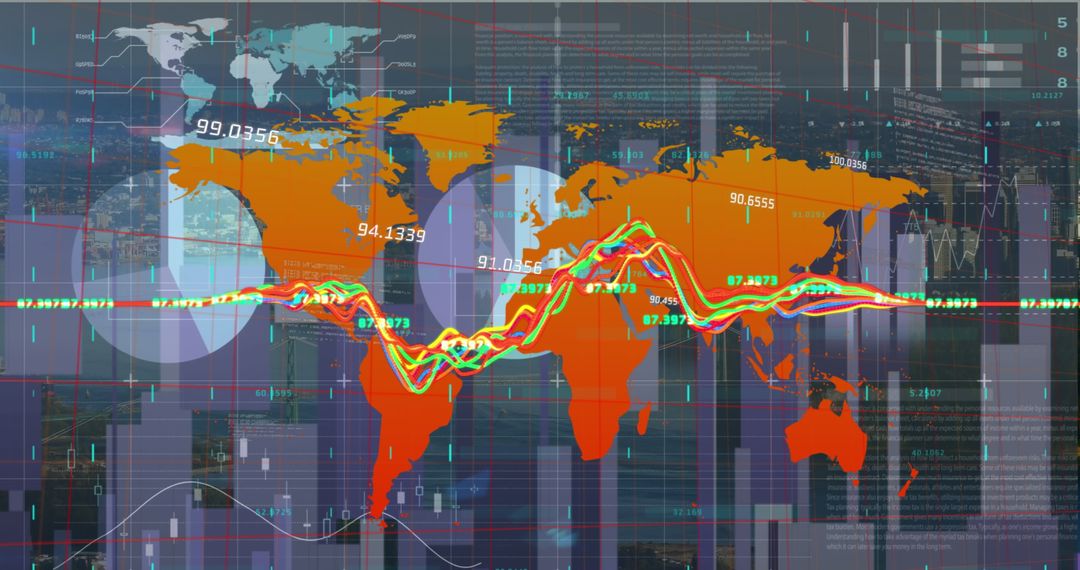
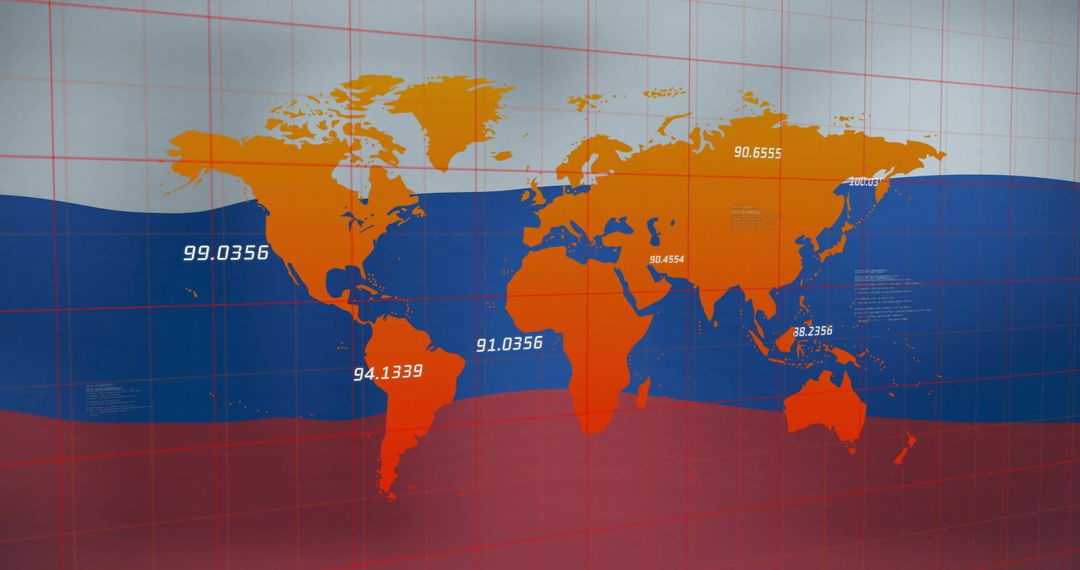
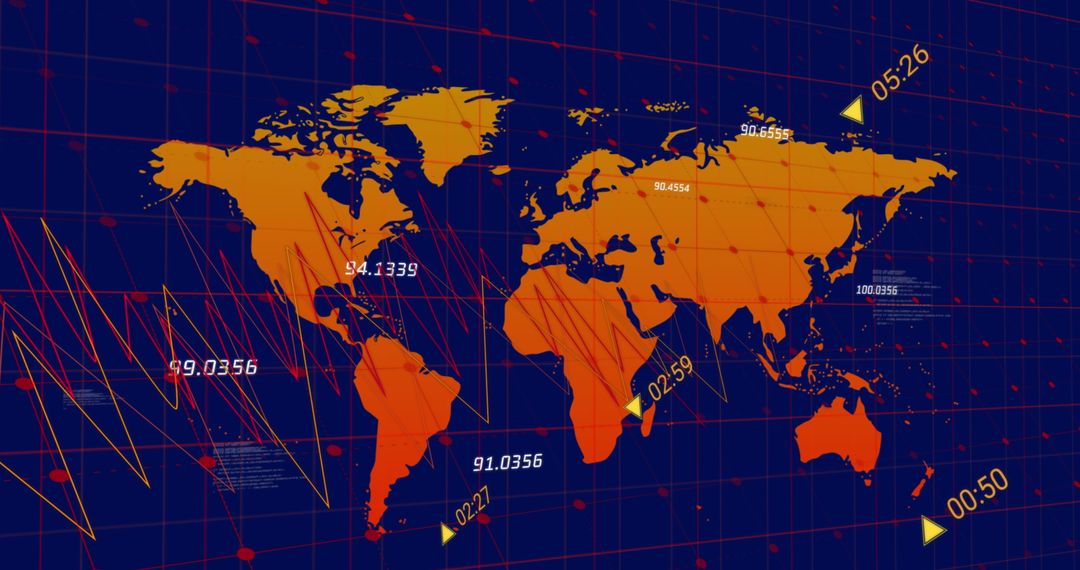
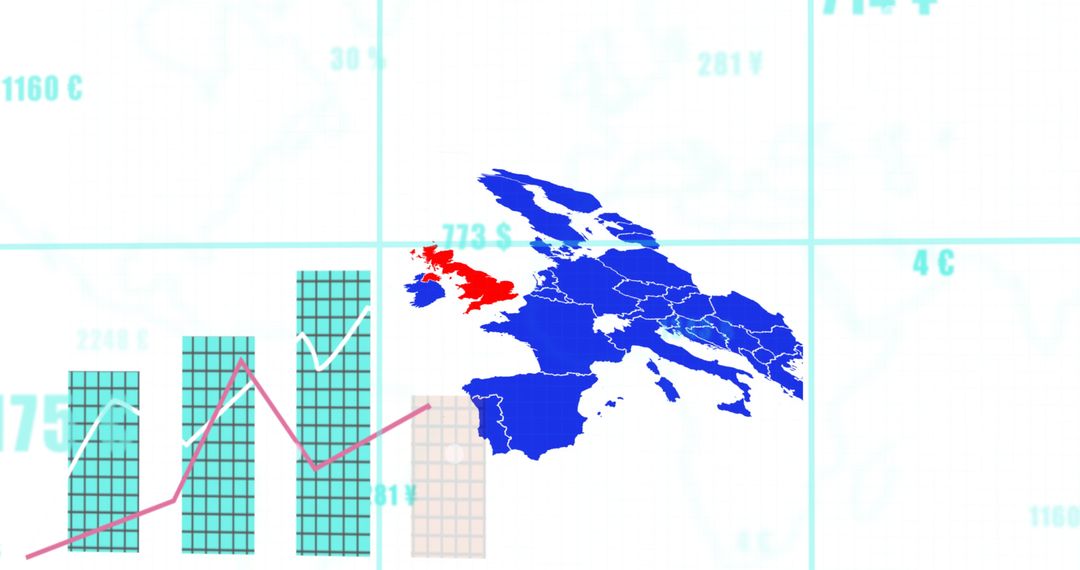
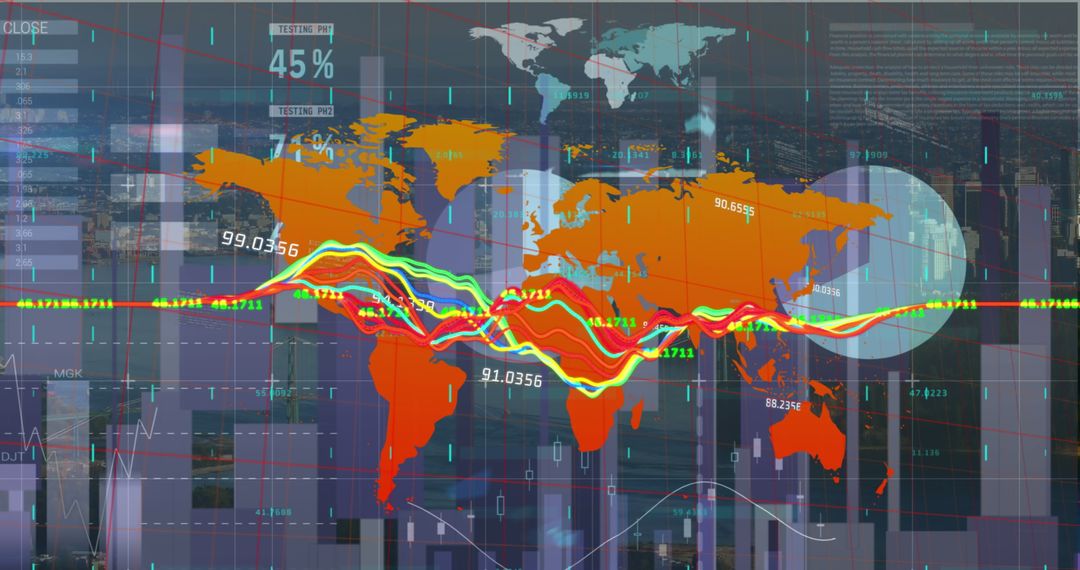
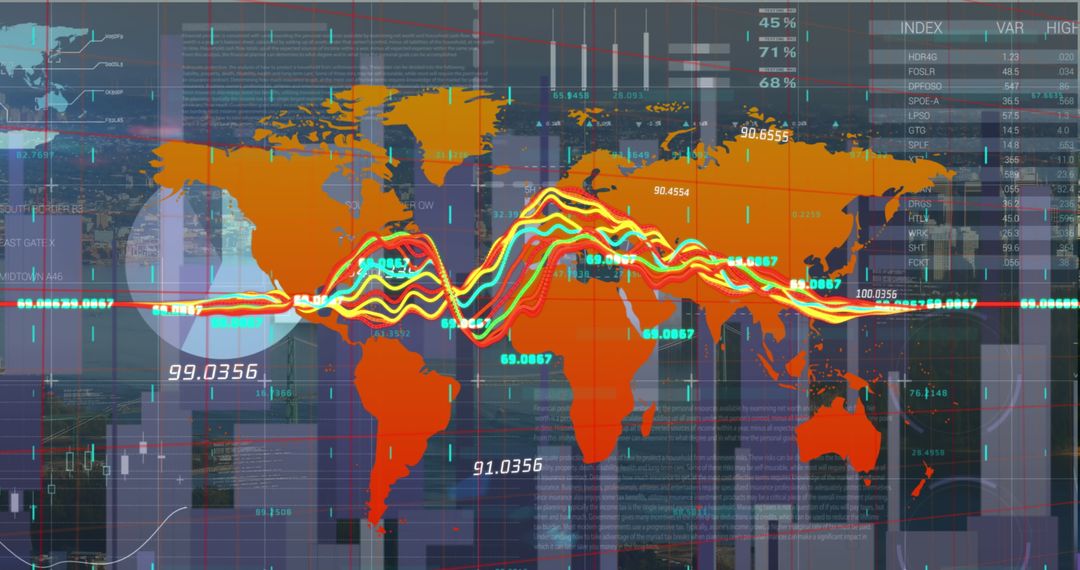
- Global Stock Market Trends and Data Analysis with World Map
Global Stock Market Trends and Data Analysis with World Map Image

Dynamic representation of global stock market trends overlaying a world map with fluctuating numerical data and financial charts. Ideal for financial reports, economic news articles, data analytics presentations, and investment guides, this visualization highlights market fluctuations and global economic interactions.
Powered by 


2
downloads
downloads
Tags:
More
Credit Photo
If you would like to credit the Photo, here are some ways you can do so
Text Link
photo Link
<span class="text-link">
<span>
<a target="_blank" href=https://pikwizard.com/photo/global-stock-market-trends-and-data-analysis-with-world-map/edc7371e819aca1fe16cc32e3eadd2d8/>PikWizard</a>
</span>
</span>
<span class="image-link">
<span
style="margin: 0 0 20px 0; display: inline-block; vertical-align: middle; width: 100%;"
>
<a
target="_blank"
href="https://pikwizard.com/photo/global-stock-market-trends-and-data-analysis-with-world-map/edc7371e819aca1fe16cc32e3eadd2d8/"
style="text-decoration: none; font-size: 10px; margin: 0;"
>
<img src="https://pikwizard.com/pw/medium/edc7371e819aca1fe16cc32e3eadd2d8.jpg" style="margin: 0; width: 100%;" alt="" />
<p style="font-size: 12px; margin: 0;">PikWizard</p>
</a>
</span>
</span>
Free (free of charge)
Free for personal and commercial use.
Author: People Creations
Similar Free Stock Images

Premium


Premium


Premium


Premium


Premium


Premium


Premium


Premium


Premium


Premium


Premium


Premium


Premium


Premium


Premium


Premium


Premium


Premium


Premium


Premium


Premium


Premium


Premium


Premium