- Home >
- Stock Photos >
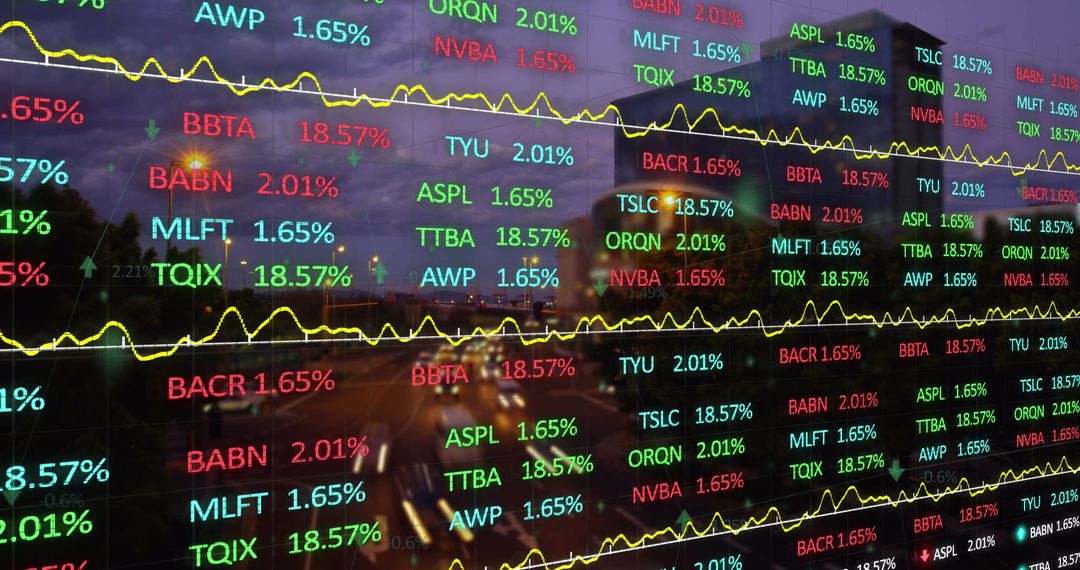
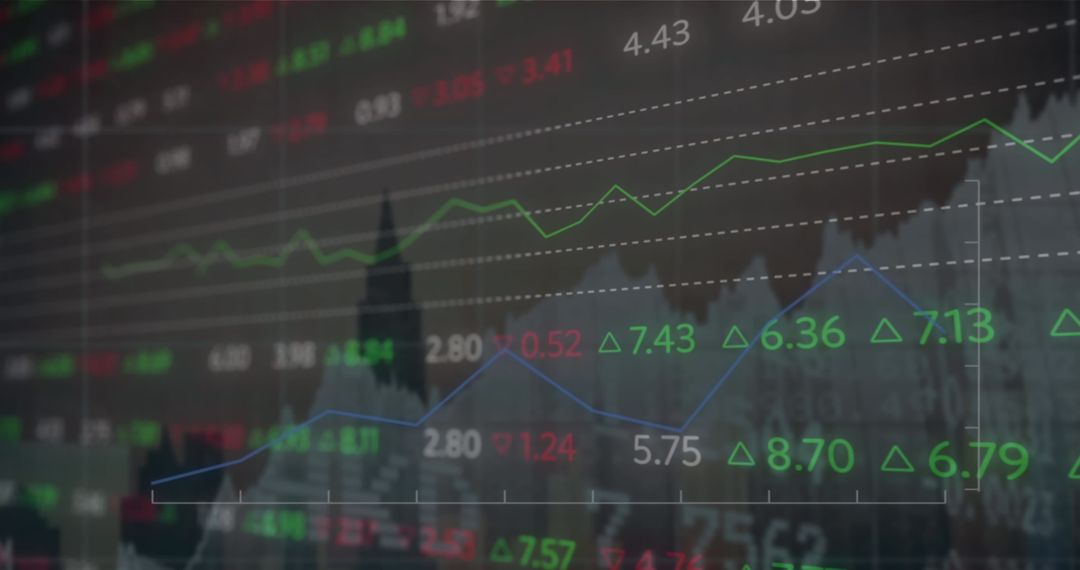
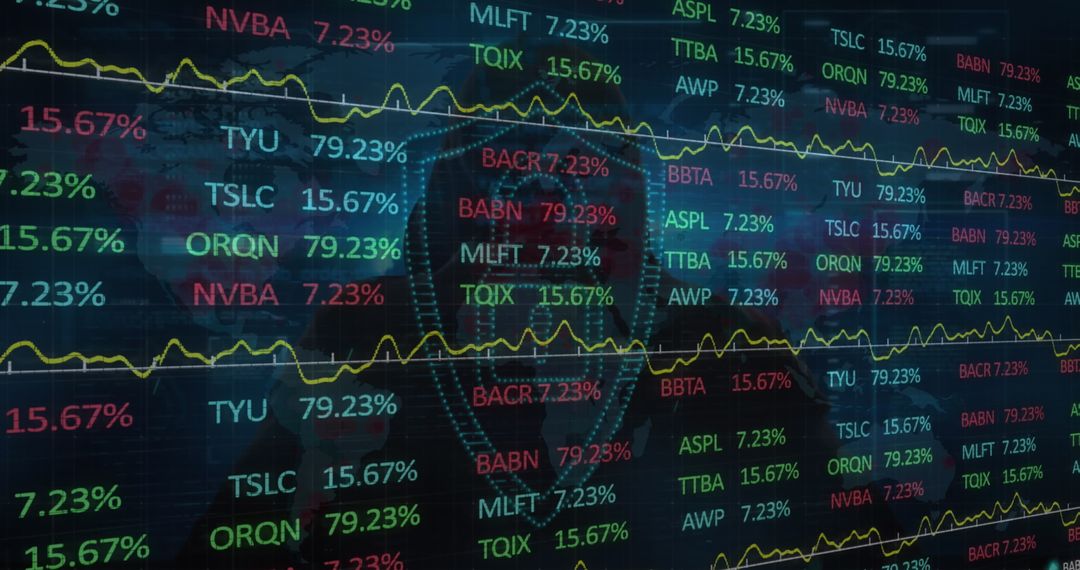
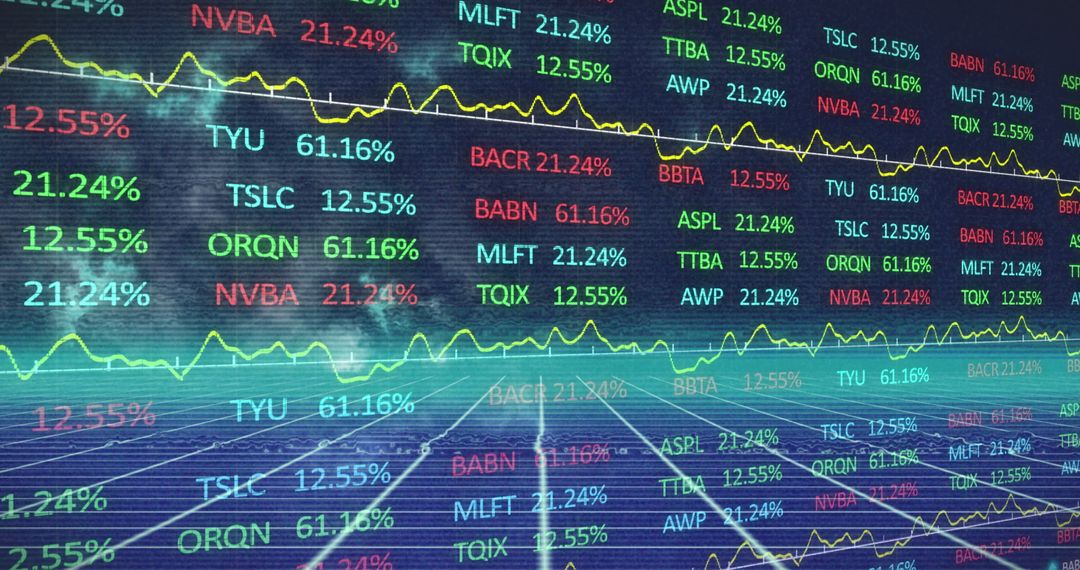
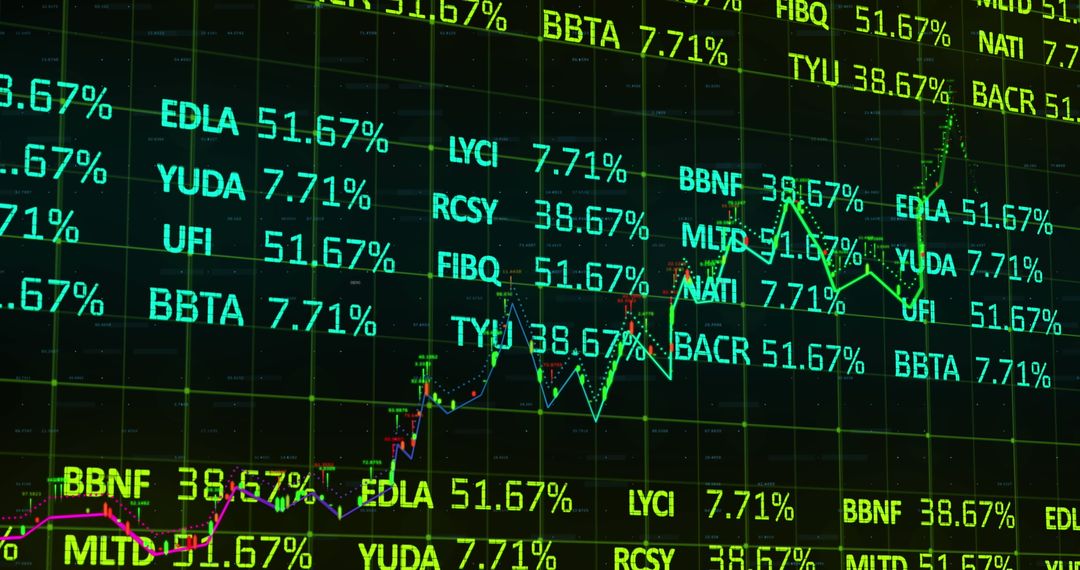
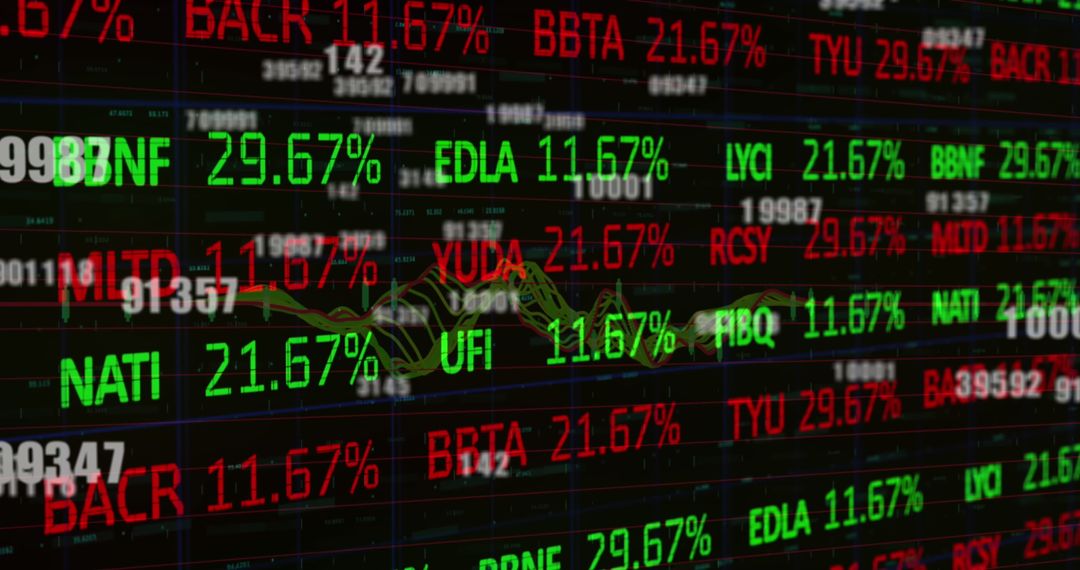
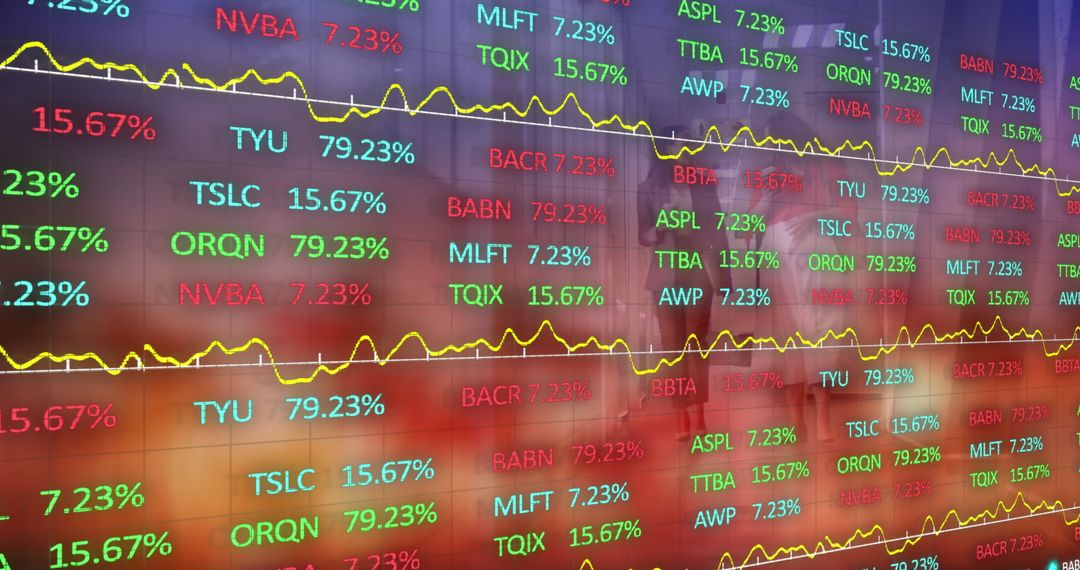
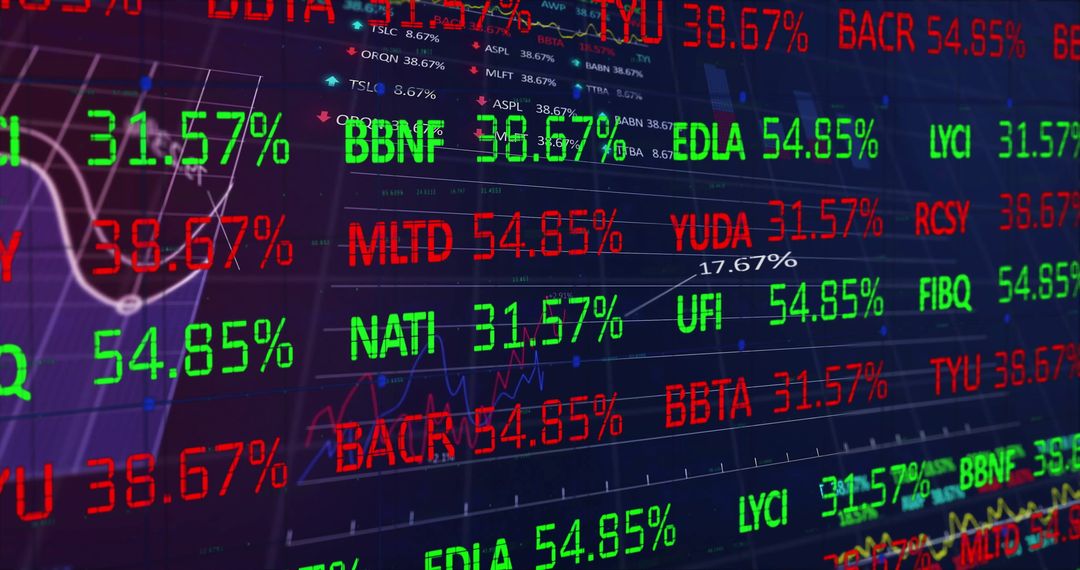
- Global Stock Market Trends and Data Visualization
Global Stock Market Trends and Data Visualization Image

All encompassing digital market display represents global financial trends and analytics, showcasing stock tickers and statistics overlayed on world map. Sleek design suitable for financial industry presentations, investment reports, or business intelligence blogs, highlighting importance of technology-based solutions in understanding financial markets actions and alignment.
Powered by  - Get 15% off with code: PIKWIZARD15


0
downloads
downloads
Tags:
More
Credit Photo
If you would like to credit the Photo, here are some ways you can do so
Text Link
photo Link
<span class="text-link">
<span>
<a target="_blank" href=https://pikwizard.com/photo/global-stock-market-trends-and-data-visualization/816574e3cea68052bedf616e2fd49bed/>PikWizard</a>
</span>
</span>
<span class="image-link">
<span
style="margin: 0 0 20px 0; display: inline-block; vertical-align: middle; width: 100%;"
>
<a
target="_blank"
href="https://pikwizard.com/photo/global-stock-market-trends-and-data-visualization/816574e3cea68052bedf616e2fd49bed/"
style="text-decoration: none; font-size: 10px; margin: 0;"
>
<img src="https://pikwizard.com/pw/medium/816574e3cea68052bedf616e2fd49bed.jpg" style="margin: 0; width: 100%;" alt="" />
<p style="font-size: 12px; margin: 0;">PikWizard</p>
</a>
</span>
</span>
Free (free of charge)
Free for personal and commercial use.
Author: Authentic Images
Similar Free Stock Images

Premium


Premium


Premium


Premium


Premium


Premium


Premium


Premium


Premium


Premium


Premium


Premium


Premium


Premium


Premium


Premium


Premium


Premium


Premium


Premium


Premium


Premium


Premium


Premium