
- Home >
- Stock Photos >
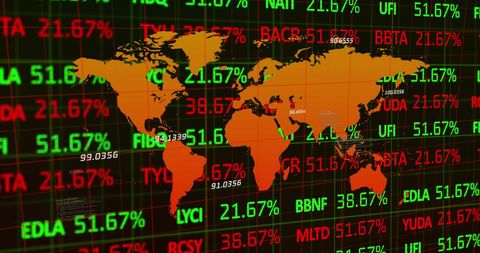
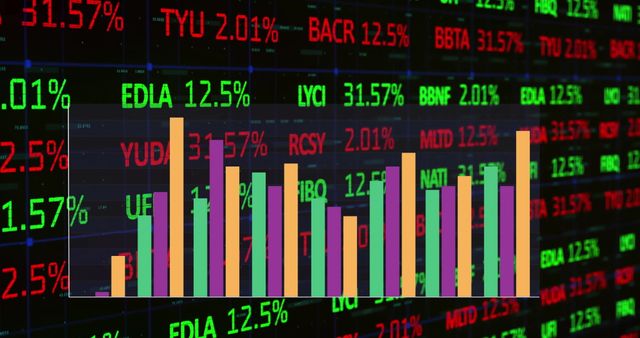
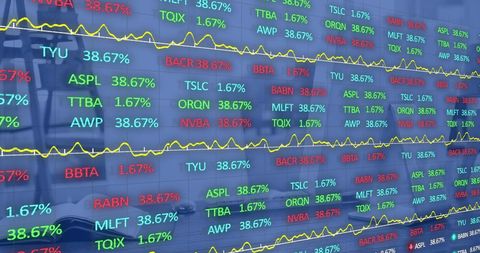
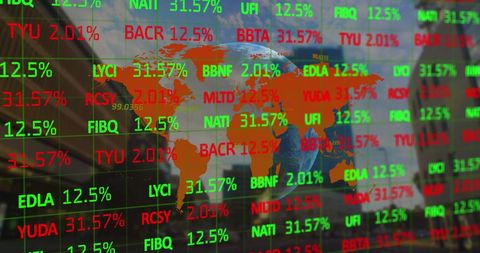
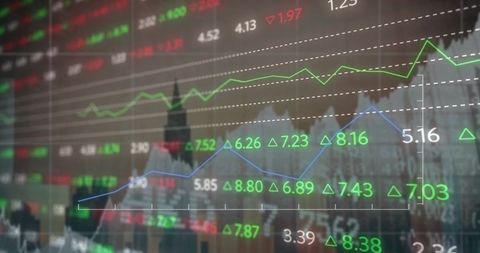
- Global Stock Market Visualization with Data Flow and Graphs
Global Stock Market Visualization with Data Flow and Graphs Image

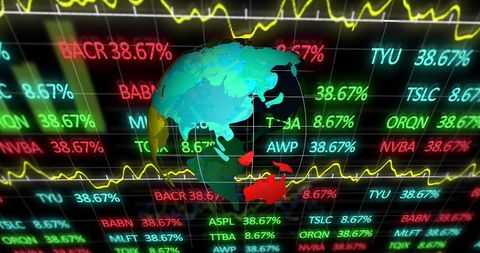
Depiction of a digital interface representing stock market data and graphical trends. Perfect for illustrating global finance concepts, trading strategies, or technological advancements in data processing. Useful in presentations about financial markets or articles on business technology.
Powered by  - Get 15% off with code: PIKWIZARD15


downloads
Tags:
More
Credit Photo
If you would like to credit the Photo, here are some ways you can do so
Text Link
photo Link
<span class="text-link">
<span>
<a target="_blank" href=https://pikwizard.com/photo/global-stock-market-visualization-with-data-flow-and-graphs/c2e56a5d2e7d0dd5807c72cebbbbe296/>PikWizard</a>
</span>
</span>
<span class="image-link">
<span
style="margin: 0 0 20px 0; display: inline-block; vertical-align: middle; width: 100%;"
>
<a
target="_blank"
href="https://pikwizard.com/photo/global-stock-market-visualization-with-data-flow-and-graphs/c2e56a5d2e7d0dd5807c72cebbbbe296/"
style="text-decoration: none; font-size: 10px; margin: 0;"
>
<img src="https://pikwizard.com/pw/medium/c2e56a5d2e7d0dd5807c72cebbbbe296.jpg" style="margin: 0; width: 100%;" alt="" />
<p style="font-size: 12px; margin: 0;">PikWizard</p>
</a>
</span>
</span>
Free (free of charge)
Free for personal and commercial use.
Author: Authentic Images
Similar Free Stock Images

Premium


Premium


Premium

Premium


Premium


Premium


Premium


Premium


Premium


Premium


Premium


Premium


Premium


Premium


Premium


Premium


Premium


Premium

Premium


Premium


Premium


Premium

Premium

Premium


Premium


Explore More Free Stock Images