- Home >
- Stock Photos >
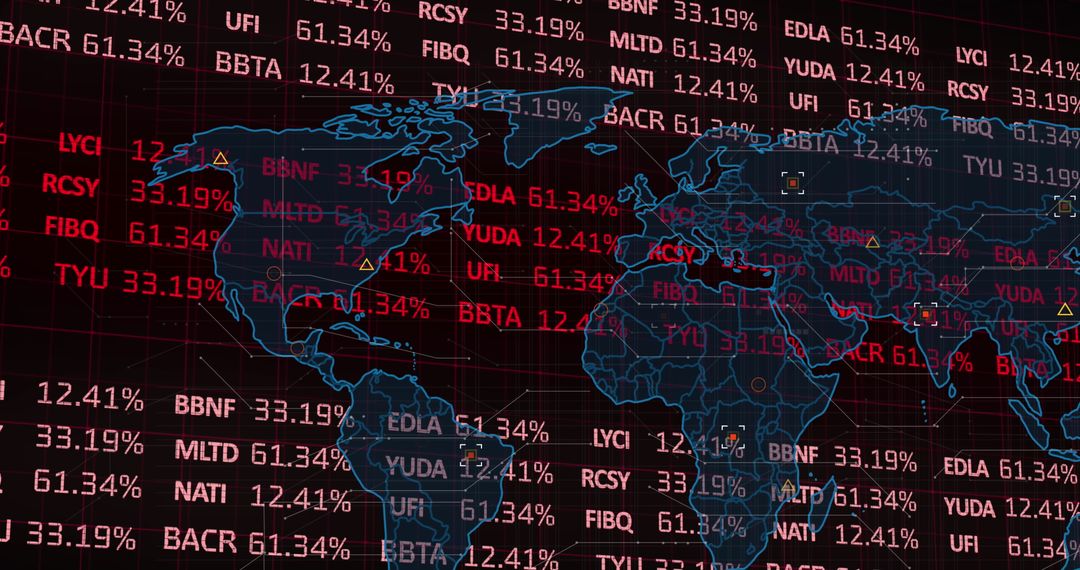
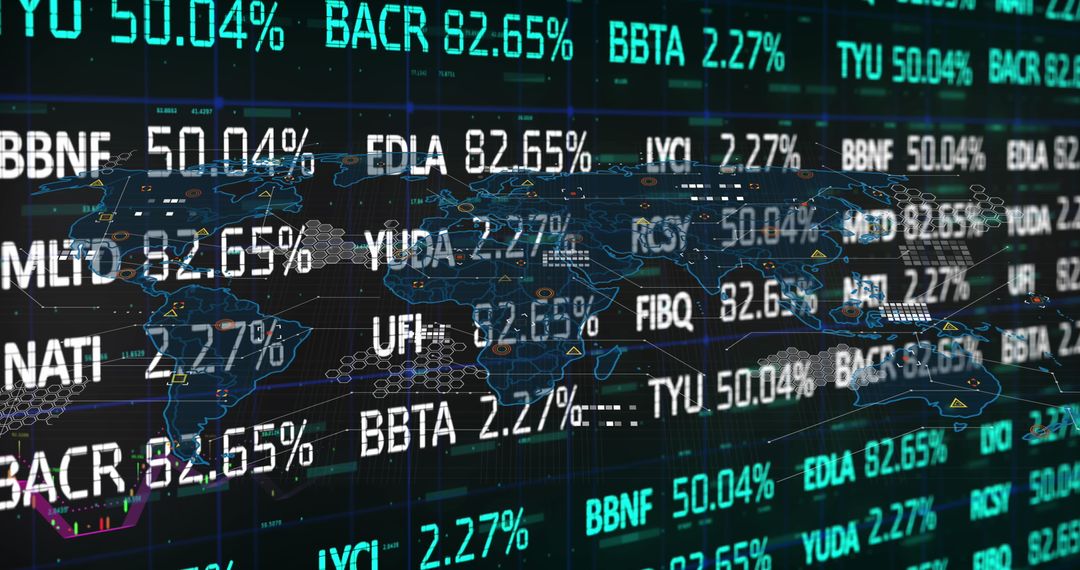
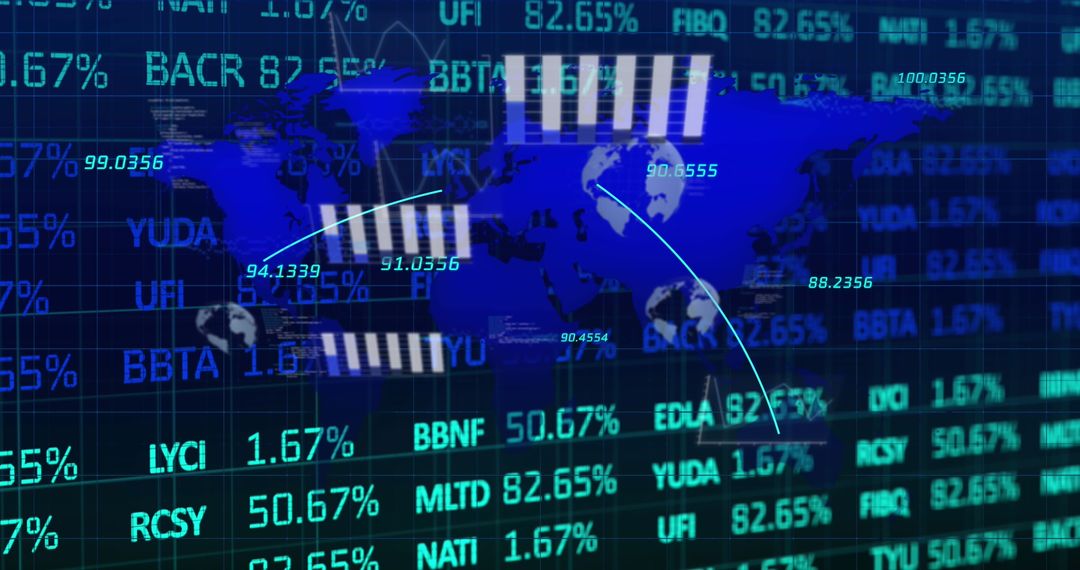
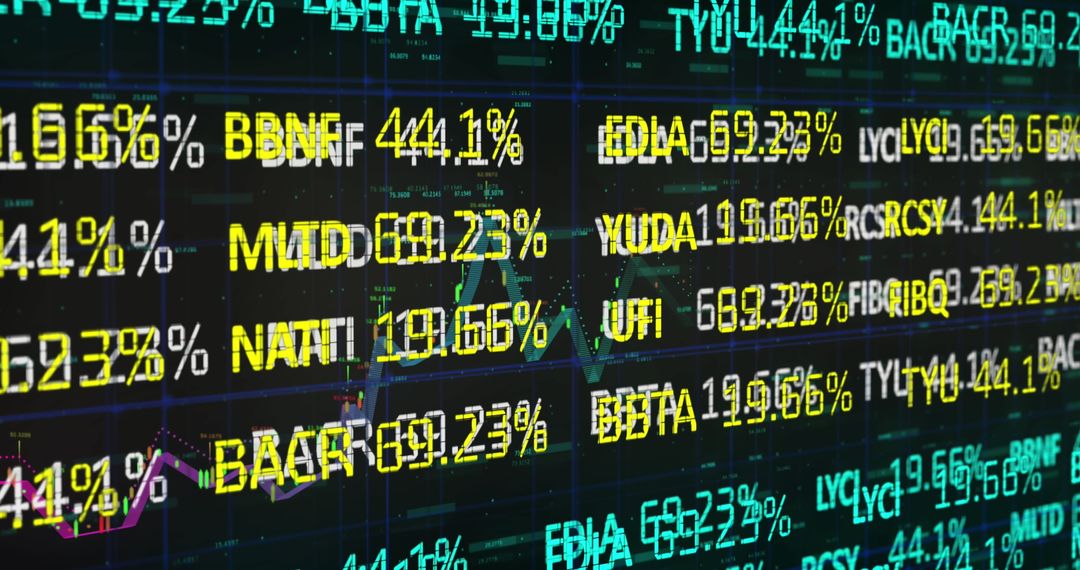
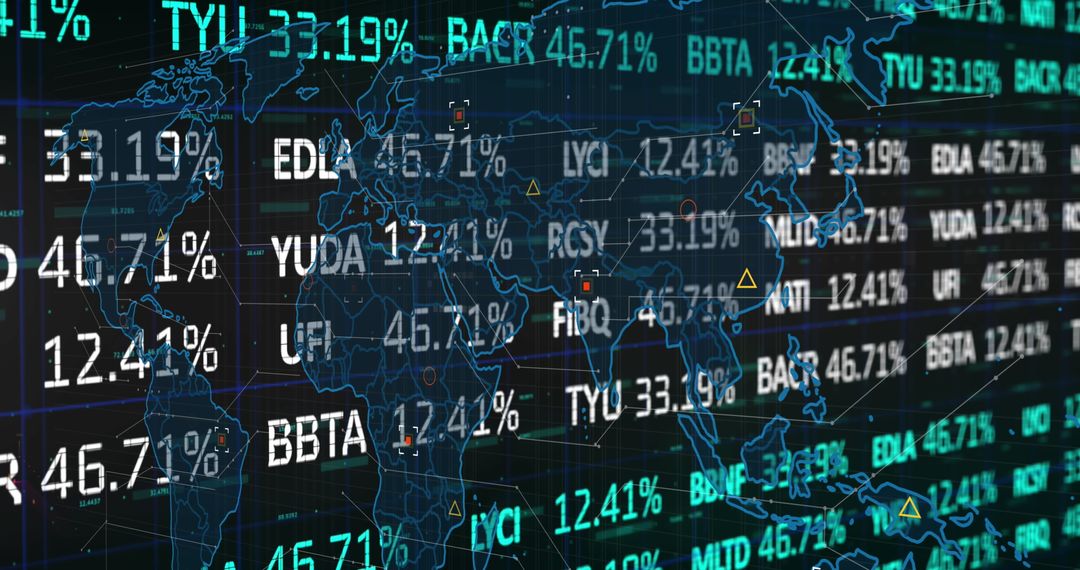
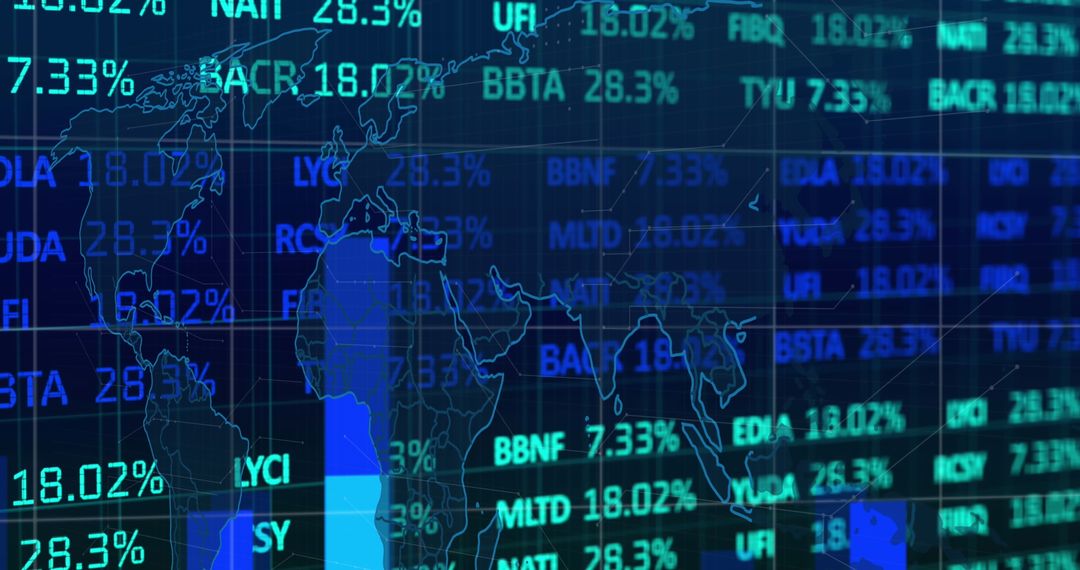
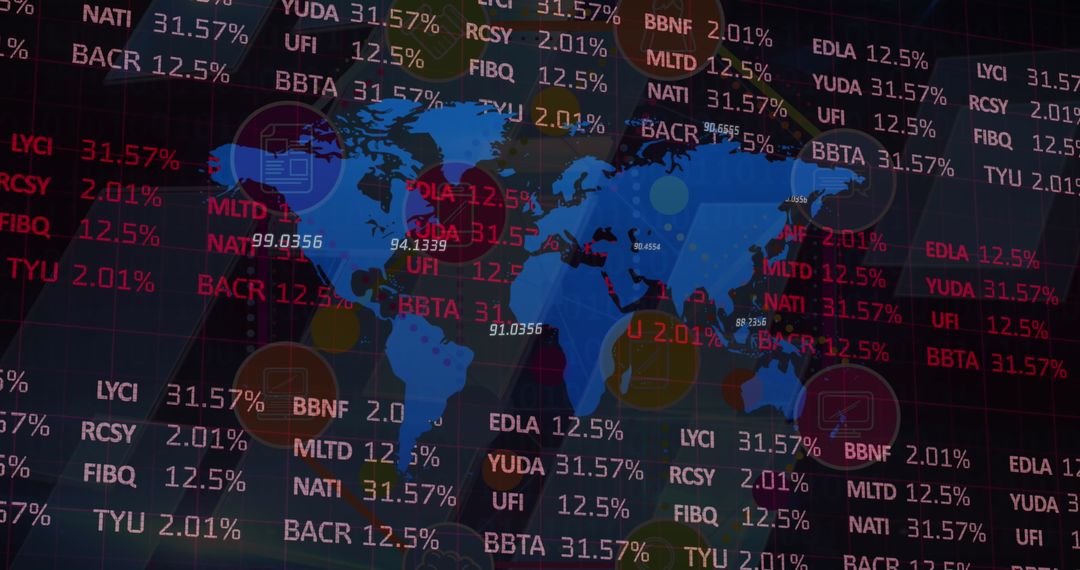
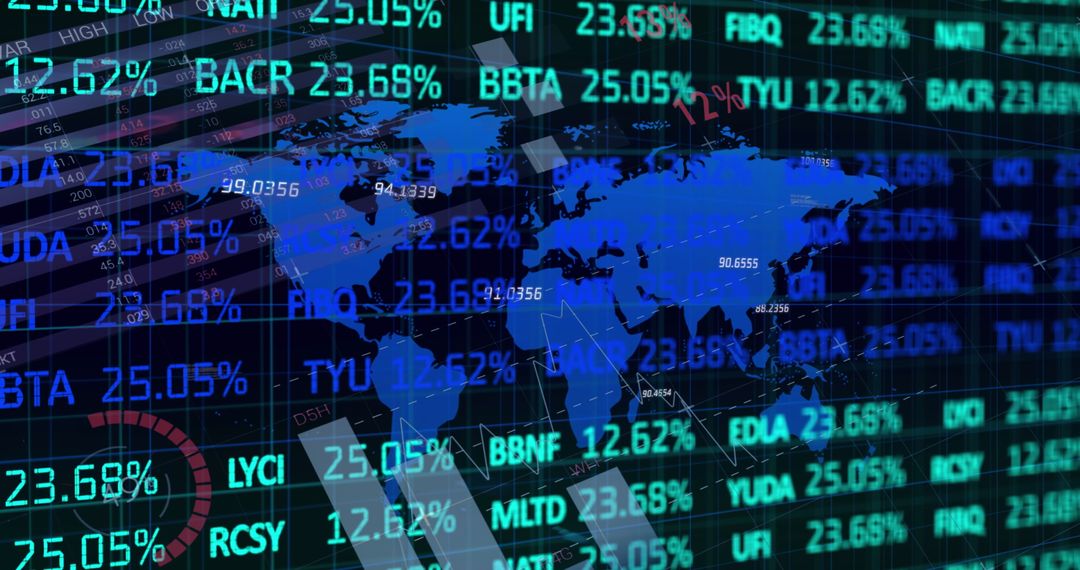
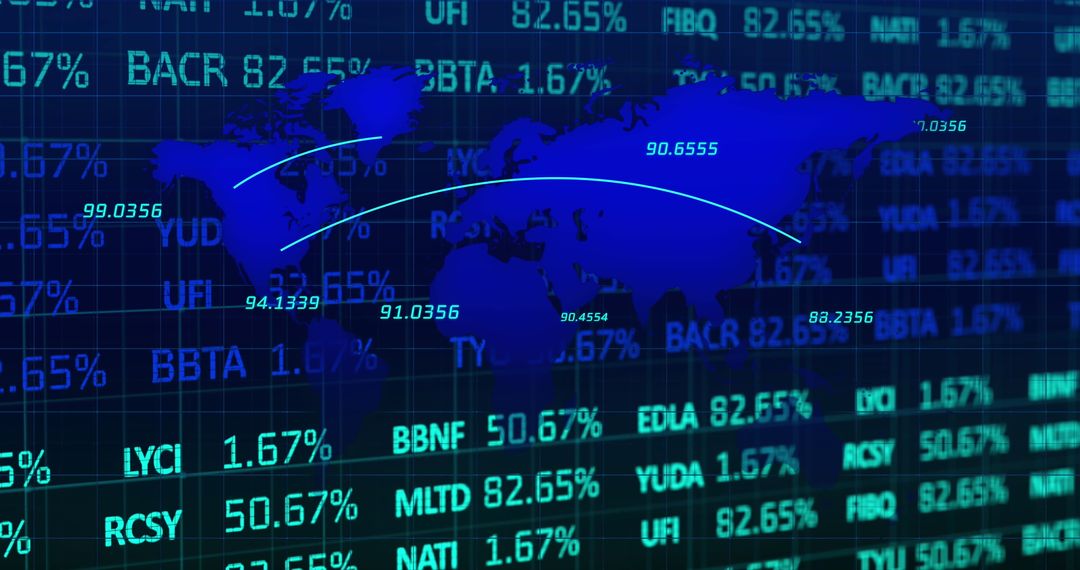
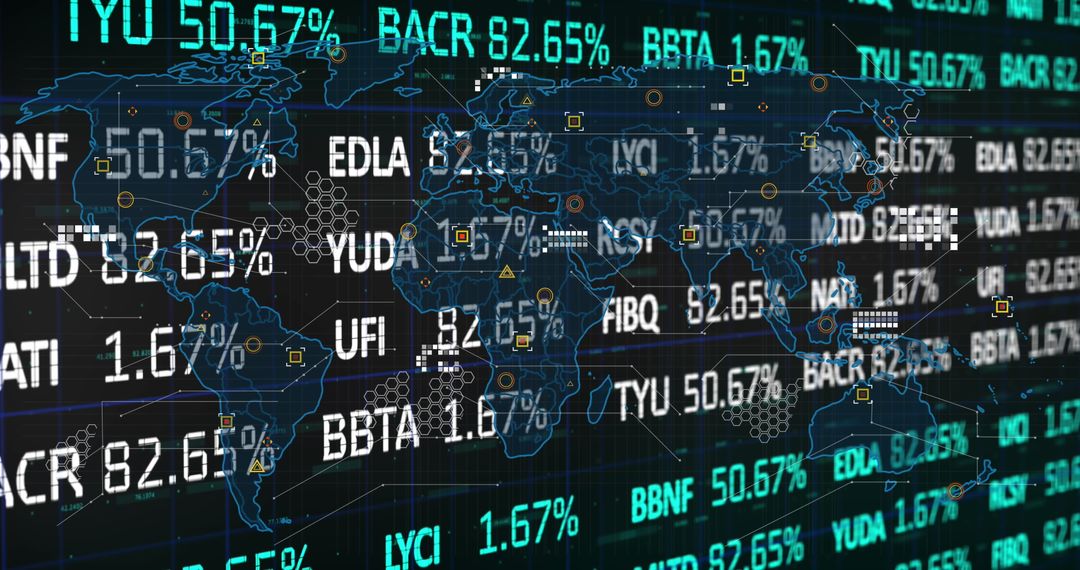
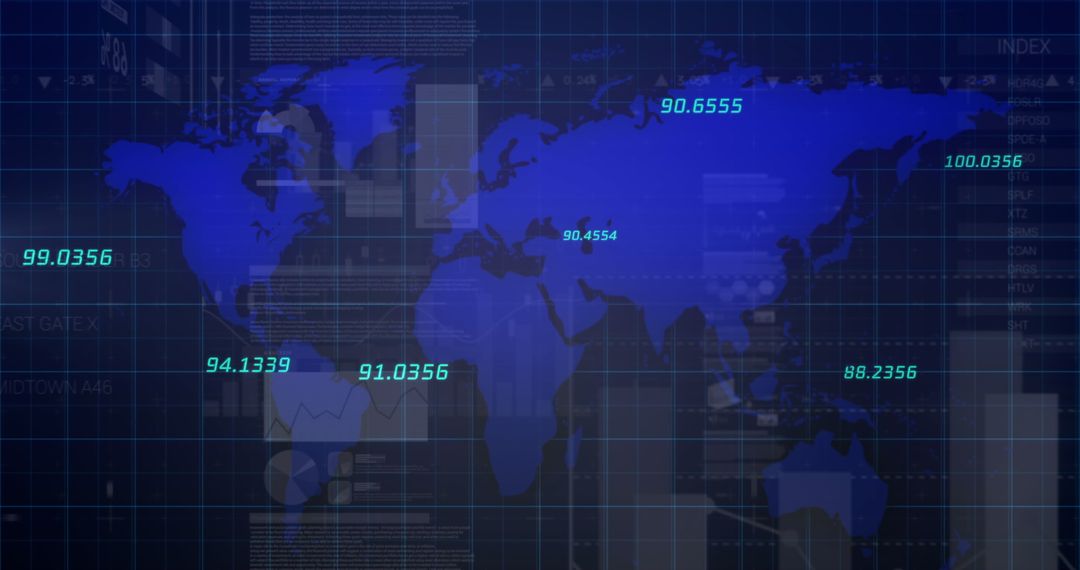
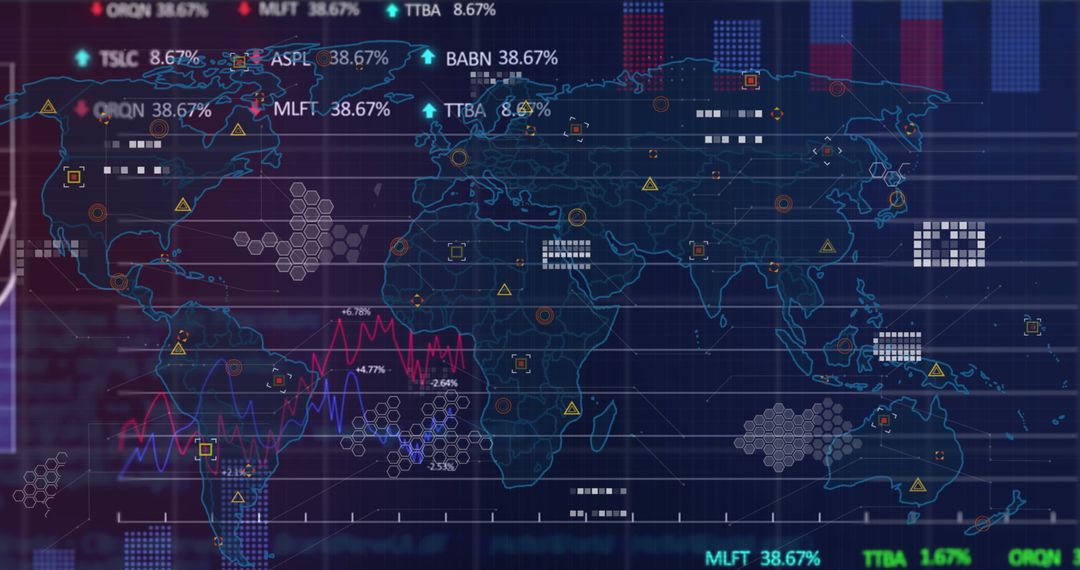
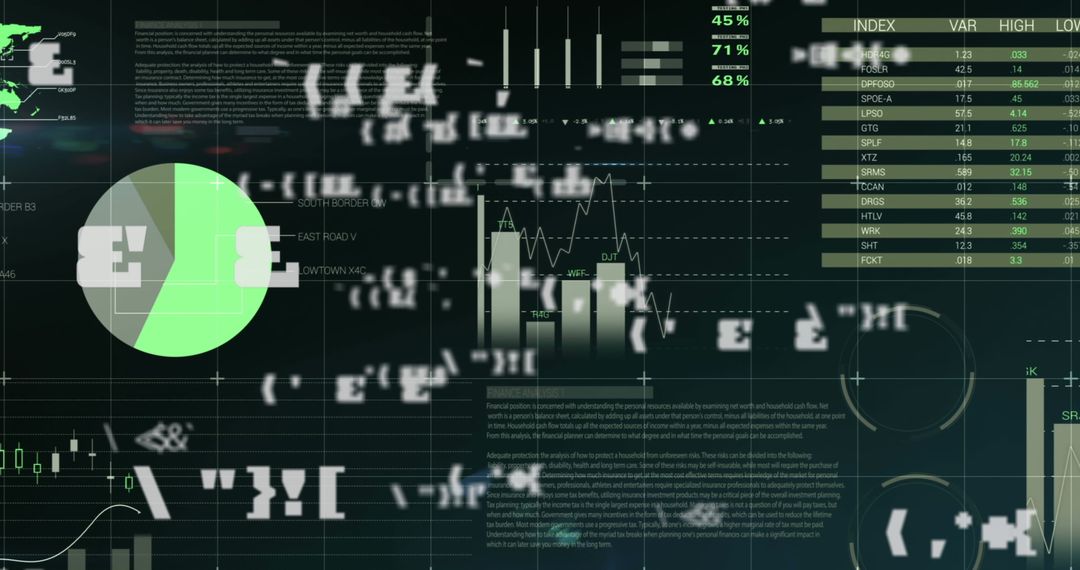
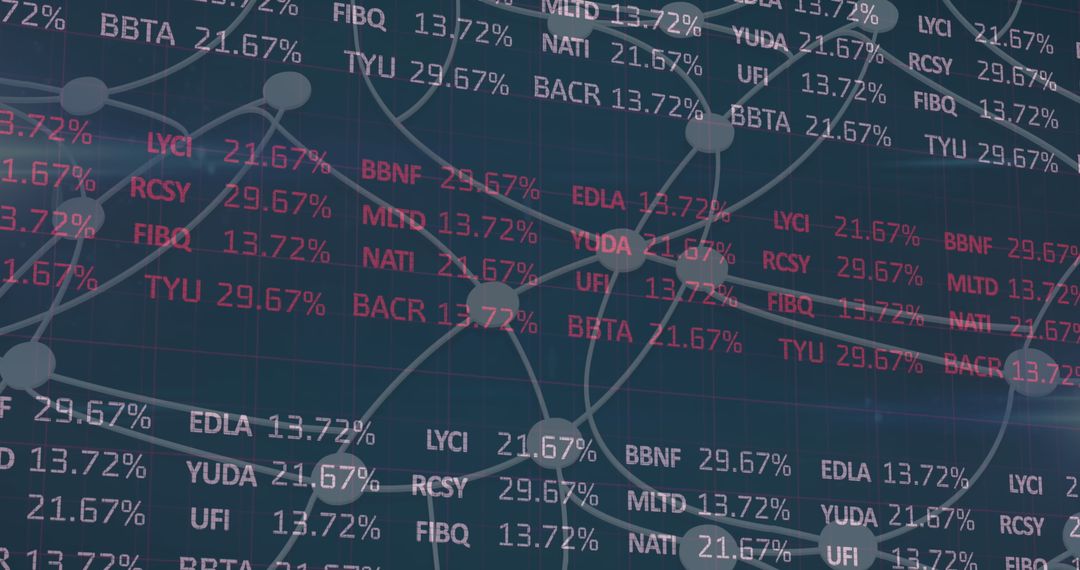
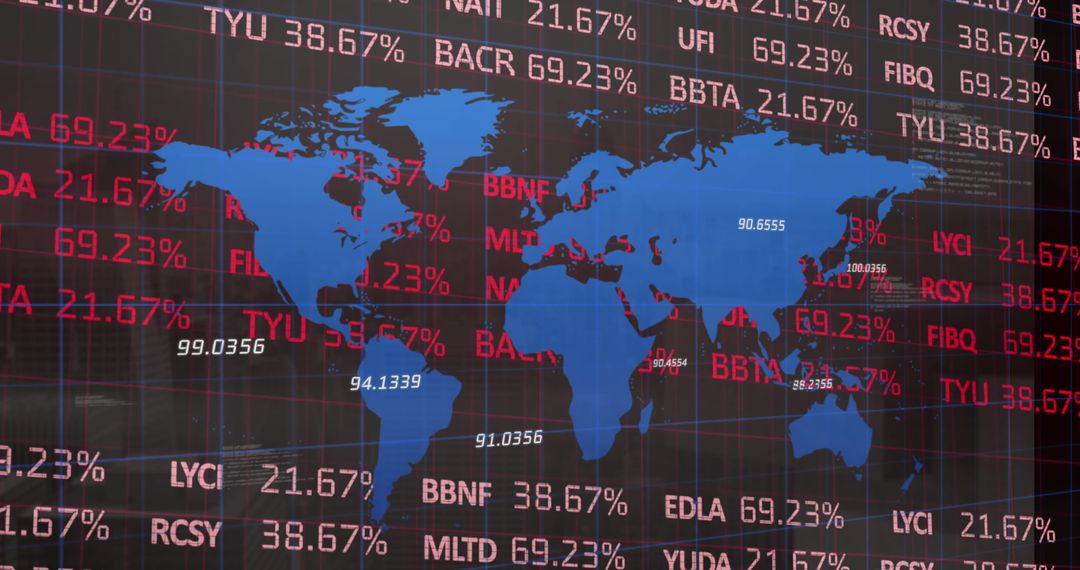
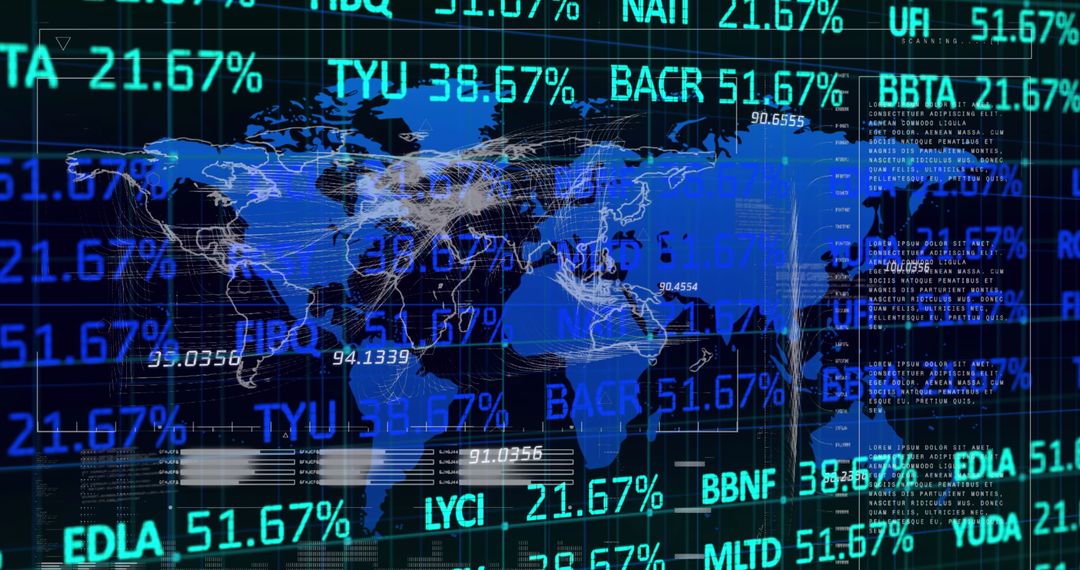
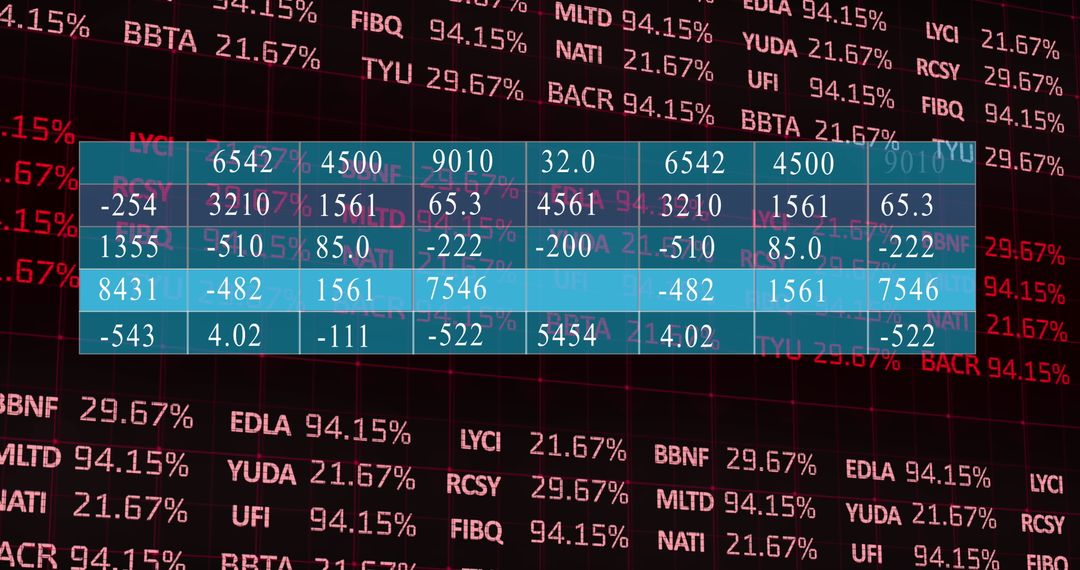
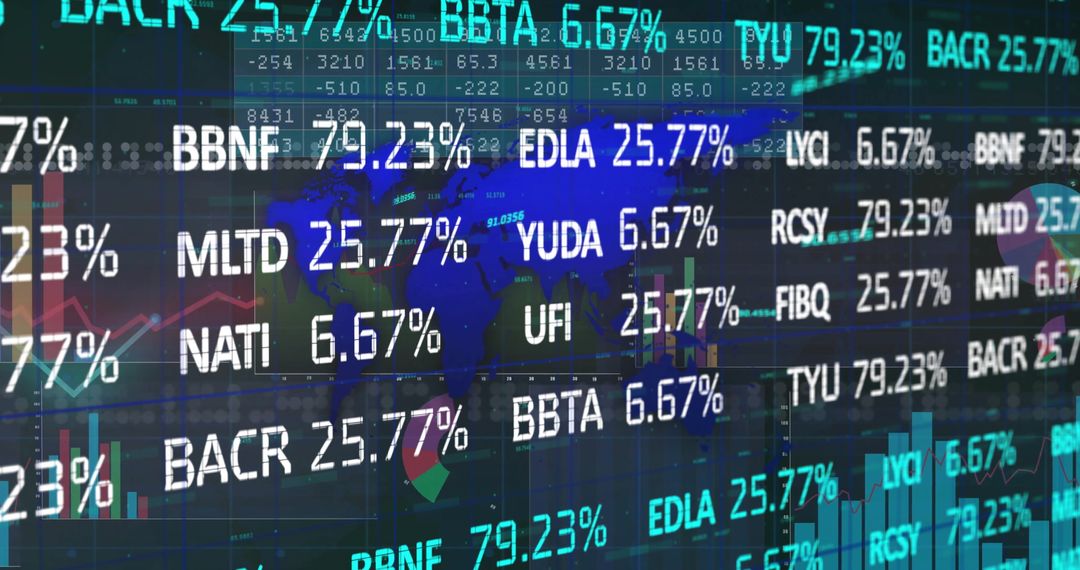
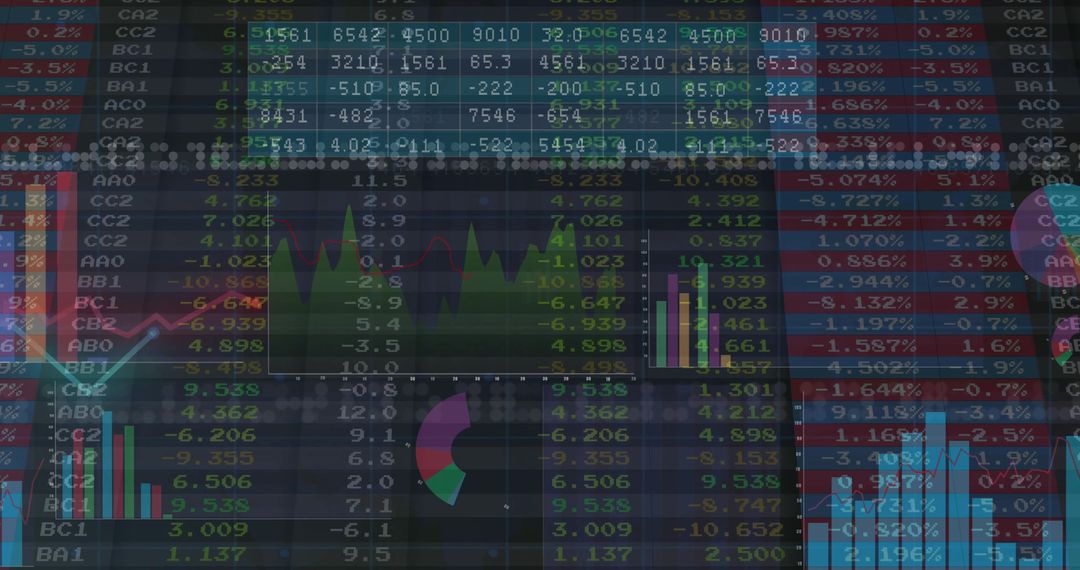
- Global Stock Tickers with Percentages on Digital Map Interface
Global Stock Tickers with Percentages on Digital Map Interface Image

World map design overlaid with stock tickers, percentages, and hexagons presents advanced financial data. Usable in financial market analytics for presentations, technology websites, cybersecurity features, financial news coverage, and investment platform dashboards.
Powered by 


2
downloads
downloads
Tags:
More
Credit Photo
If you would like to credit the Photo, here are some ways you can do so
Text Link
photo Link
<span class="text-link">
<span>
<a target="_blank" href=https://pikwizard.com/photo/global-stock-tickers-with-percentages-on-digital-map-interface/e797b753c605fc734a574f05c7616b01/>PikWizard</a>
</span>
</span>
<span class="image-link">
<span
style="margin: 0 0 20px 0; display: inline-block; vertical-align: middle; width: 100%;"
>
<a
target="_blank"
href="https://pikwizard.com/photo/global-stock-tickers-with-percentages-on-digital-map-interface/e797b753c605fc734a574f05c7616b01/"
style="text-decoration: none; font-size: 10px; margin: 0;"
>
<img src="https://pikwizard.com/pw/medium/e797b753c605fc734a574f05c7616b01.jpg" style="margin: 0; width: 100%;" alt="" />
<p style="font-size: 12px; margin: 0;">PikWizard</p>
</a>
</span>
</span>
Free (free of charge)
Free for personal and commercial use.
Author: Authentic Images
Similar Free Stock Images
Premium


Premium


Premium


Premium


Premium


Premium


Premium


Premium


Premium


Premium


Premium


Premium


Premium

Premium


Premium


Premium


Premium


Premium


Premium


Premium


Premium


Premium


Premium


Premium