- Home >
- Stock Photos >
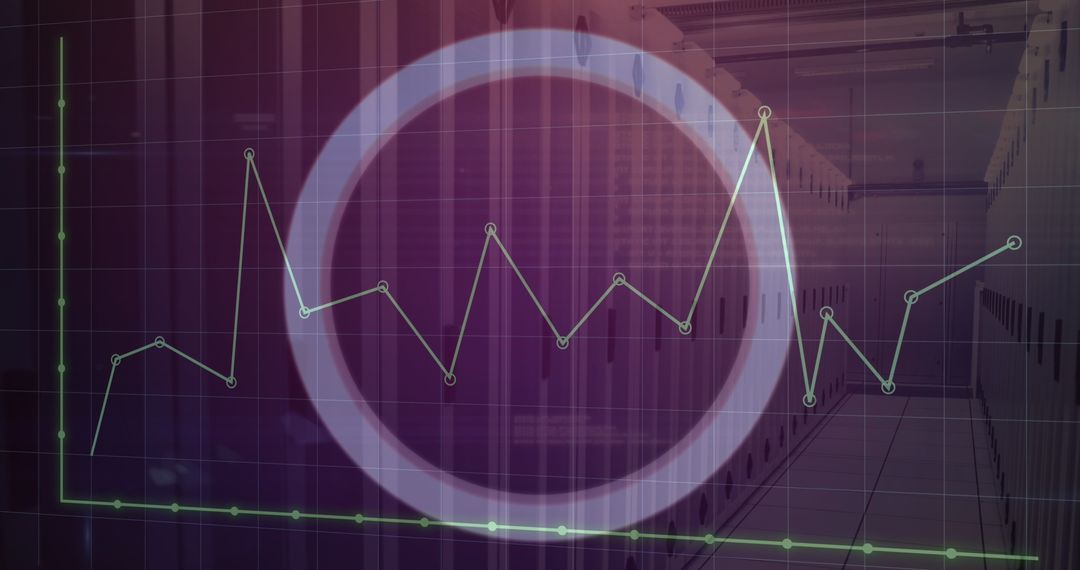
- Global Trade Uncertainty Visualized with Economic Graphs
Global Trade Uncertainty Visualized with Economic Graphs Image
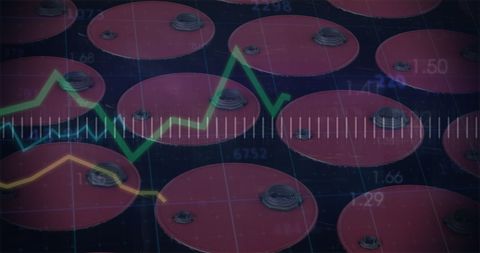
Overlay of economic graphs on barrel tops symbolizes instability and uncertainty in global trade markets. This metaphor for market fluctuation may be used in articles about economic impact, analyses on international politics related to the Ukraine crisis, or infographics explaining global economic trends and their consequences.
Powered by  - Get 15% off with code: PIKWIZARD15


Credit Photo
If you would like to credit the Photo, here are some ways you can do so
Text Link
photo Link
<span class="text-link">
<span>
<a target="_blank" href=https://pikwizard.com/photo/global-trade-uncertainty-visualized-with-economic-graphs/8b5713526c1fb746cea7937ada8fa890/>PikWizard</a>
</span>
</span>
<span class="image-link">
<span
style="margin: 0 0 20px 0; display: inline-block; vertical-align: middle; width: 100%;"
>
<a
target="_blank"
href="https://pikwizard.com/photo/global-trade-uncertainty-visualized-with-economic-graphs/8b5713526c1fb746cea7937ada8fa890/"
style="text-decoration: none; font-size: 10px; margin: 0;"
>
<img src="https://pikwizard.com/pw/medium/8b5713526c1fb746cea7937ada8fa890.jpg" style="margin: 0; width: 100%;" alt="" />
<p style="font-size: 12px; margin: 0;">PikWizard</p>
</a>
</span>
</span>
Free (free of charge)
Free for personal and commercial use.
Author: People Creations
Similar Free Stock Images
Premium


Premium


Premium


Premium


Premium


Premium


Premium


Premium


Premium


Premium


Premium


Premium


Premium


Premium


Premium


Premium


Premium


Premium


Premium


Premium


Premium


Premium


Premium


Premium