
- Home >
- Stock Photos >
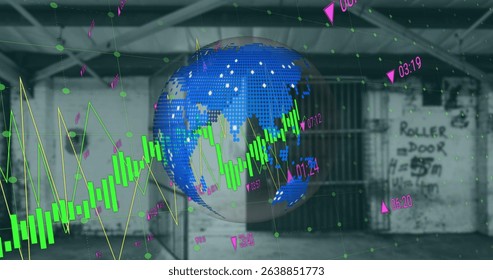
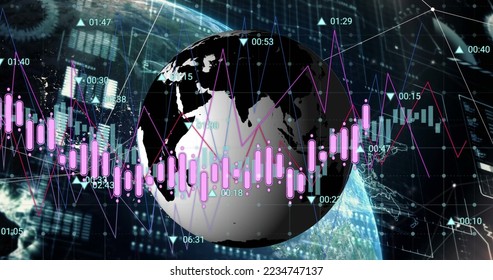
- Globe with Digital Data and Financial Graph Interface
Globe with Digital Data and Financial Graph Interface Image

This visualization depicts a spinning globe overlaid with digital data and financial graphs. It represents global connections and the movement of information across the world, illustrating the intricacies of financial analytics and international markets. This could be useful for websites, blogs, and presentations focused on finance, technology, international business, data analysis, or global economics.
Powered by  - Get 15% off with code: PIKWIZARD15


downloads
Tags:
More
Credit Photo
If you would like to credit the Photo, here are some ways you can do so
Text Link
photo Link
<span class="text-link">
<span>
<a target="_blank" href=https://pikwizard.com/photo/globe-with-digital-data-and-financial-graph-interface/76bd81e5297b2a60178c4713baf944a6/>PikWizard</a>
</span>
</span>
<span class="image-link">
<span
style="margin: 0 0 20px 0; display: inline-block; vertical-align: middle; width: 100%;"
>
<a
target="_blank"
href="https://pikwizard.com/photo/globe-with-digital-data-and-financial-graph-interface/76bd81e5297b2a60178c4713baf944a6/"
style="text-decoration: none; font-size: 10px; margin: 0;"
>
<img src="https://pikwizard.com/pw/medium/76bd81e5297b2a60178c4713baf944a6.jpg" style="margin: 0; width: 100%;" alt="" />
<p style="font-size: 12px; margin: 0;">PikWizard</p>
</a>
</span>
</span>
Free (free of charge)
Free for personal and commercial use.
Author: Authentic Images
Similar Free Stock Images

Premium


Premium


Premium


Premium


Premium


Premium

Premium


Premium


Premium


Premium


Premium


Premium


Premium


Premium


Premium


Premium


Premium


Premium


Premium

Premium


Premium


Premium


Premium


Premium


Premium


Explore More Free Stock Images