
- Home >
- Stock Photos >
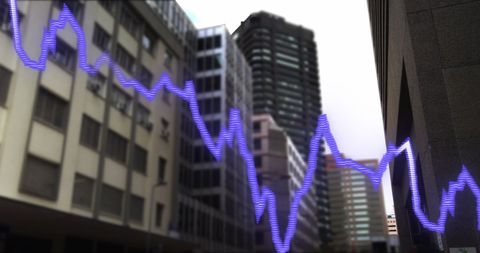
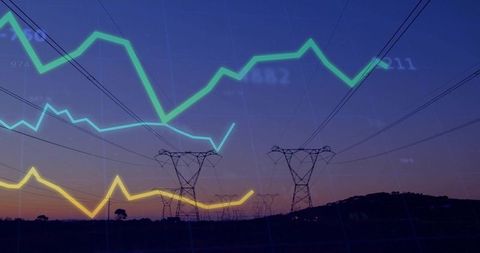
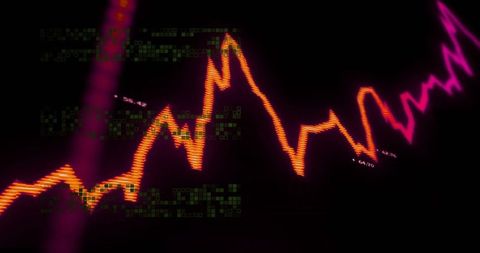
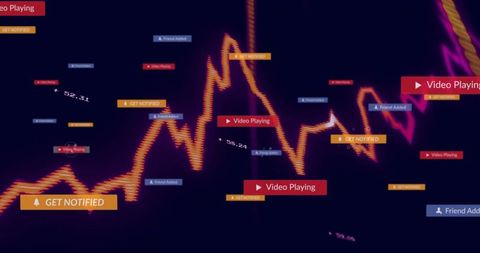
- Glowing Animated Chart on Digital Interface with Data Stats
Glowing Animated Chart on Digital Interface with Data Stats Image

Intriguing visualization of an animated financial chart with glowing lines on a digital display signifies technology and innovation in analytics. Suitable for use in articles about market forecasts, technological advancements in financial analysis, or showcasing economic trends and data insights. Ideal for presentations, publications, or promotional material related to finance and investment sectors.
Powered by 


downloads
Tags:
More
Credit Photo
If you would like to credit the Photo, here are some ways you can do so
Text Link
photo Link
<span class="text-link">
<span>
<a target="_blank" href=https://pikwizard.com/photo/glowing-animated-chart-on-digital-interface-with-data-stats/6da08bd6cb710f273b6396bfa3eb9955/>PikWizard</a>
</span>
</span>
<span class="image-link">
<span
style="margin: 0 0 20px 0; display: inline-block; vertical-align: middle; width: 100%;"
>
<a
target="_blank"
href="https://pikwizard.com/photo/glowing-animated-chart-on-digital-interface-with-data-stats/6da08bd6cb710f273b6396bfa3eb9955/"
style="text-decoration: none; font-size: 10px; margin: 0;"
>
<img src="https://pikwizard.com/pw/medium/6da08bd6cb710f273b6396bfa3eb9955.jpg" style="margin: 0; width: 100%;" alt="" />
<p style="font-size: 12px; margin: 0;">PikWizard</p>
</a>
</span>
</span>
Free (free of charge)
Free for personal and commercial use.
Author: People Creations
Similar Free Stock Images

Premium


Premium

Premium


Premium


Premium


Premium

Premium


Premium


Premium

Premium

Premium


Premium


Premium


Premium

Premium

Premium


Premium


Premium


Premium


Premium


Premium

Premium


Premium


Premium


Premium

Explore More Free Stock Images