
- Home >
- Stock Photos >
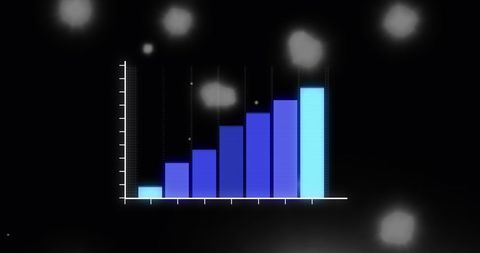
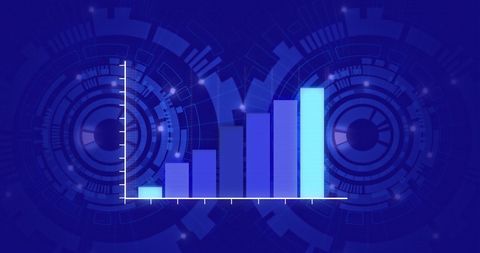
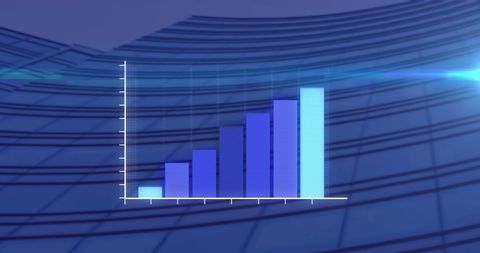
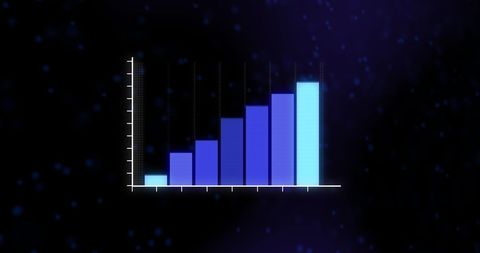
- Glowing Blue Bar Chart on Futuristic Digital Background
Glowing Blue Bar Chart on Futuristic Digital Background Image
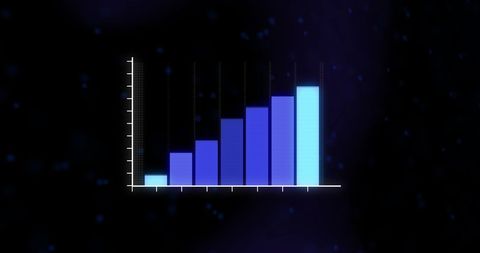
A glowing blue bar chart on a dark digital background, highlighting progressive growth and advancement. Useful for illustrating business performance analysis, financial projects, economic studies, or showcasing advancements in digital data processing and statistics.
Powered by  - Get 15% off with code: PIKWIZARD15


4
downloads
downloads
Tags:
More
Credit Photo
If you would like to credit the Photo, here are some ways you can do so
Text Link
photo Link
<span class="text-link">
<span>
<a target="_blank" href=https://pikwizard.com/photo/glowing-blue-bar-chart-on-futuristic-digital-background/2380be885cae6f28c2439bad86fe4b13/>PikWizard</a>
</span>
</span>
<span class="image-link">
<span
style="margin: 0 0 20px 0; display: inline-block; vertical-align: middle; width: 100%;"
>
<a
target="_blank"
href="https://pikwizard.com/photo/glowing-blue-bar-chart-on-futuristic-digital-background/2380be885cae6f28c2439bad86fe4b13/"
style="text-decoration: none; font-size: 10px; margin: 0;"
>
<img src="https://pikwizard.com/pw/medium/2380be885cae6f28c2439bad86fe4b13.jpg" style="margin: 0; width: 100%;" alt="" />
<p style="font-size: 12px; margin: 0;">PikWizard</p>
</a>
</span>
</span>
Free (free of charge)
Free for personal and commercial use.
Author: Creative Art
Similar Free Stock Images
Loading...

Premium


Premium


Premium


Premium


Premium

Premium


Premium


Premium

Premium

Premium
Premium


Premium

Premium


Premium


Premium


Premium

Premium


Premium

Premium
Premium


Premium


Premium


Premium

Premium


Premium
