- Home >
- Stock Photos >
- Glowing Data Cluster Visualizing Global Network Heatmap, Metrics and Candlestick Charts
Glowing Data Cluster Visualizing Global Network Heatmap, Metrics and Candlestick Charts Image

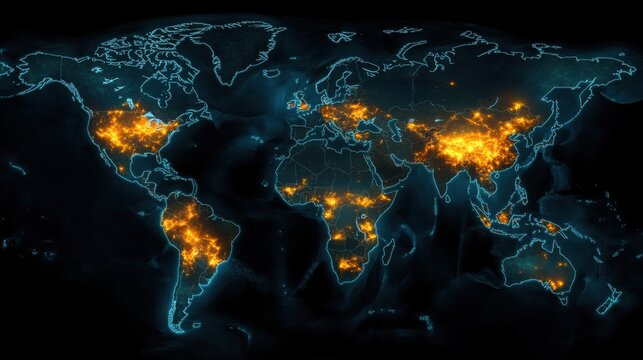
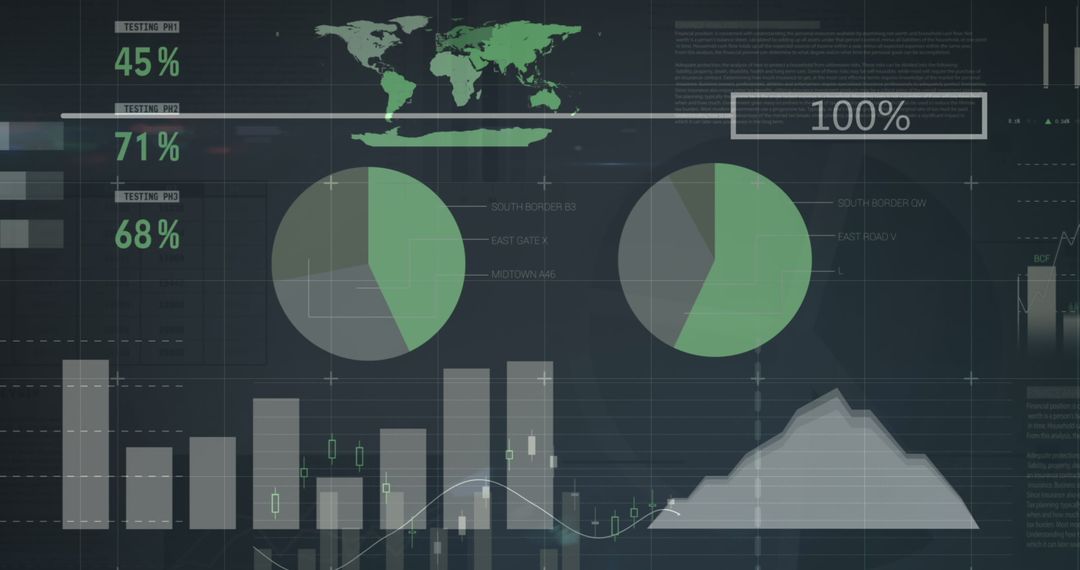
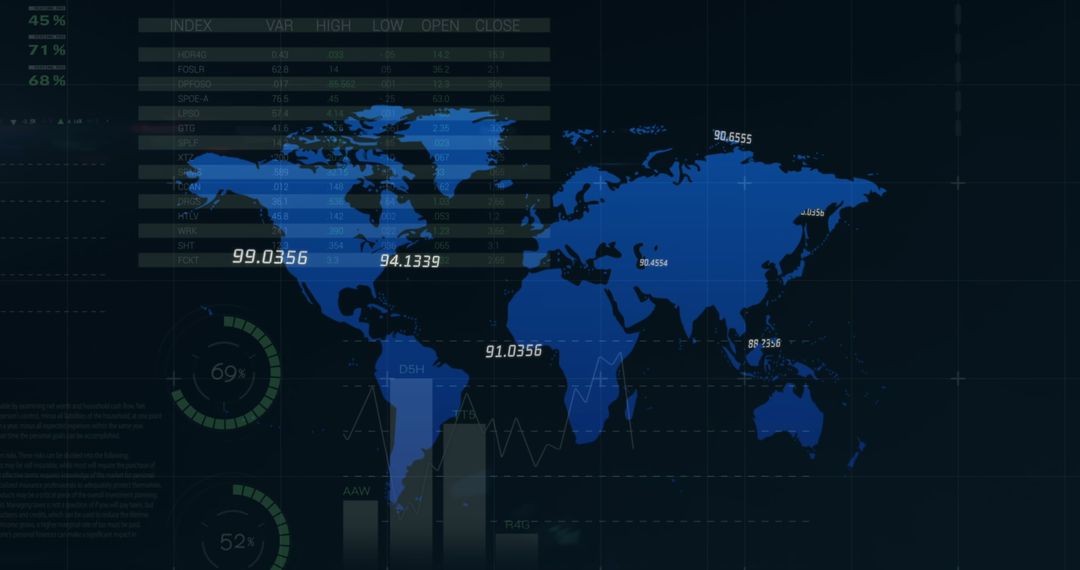
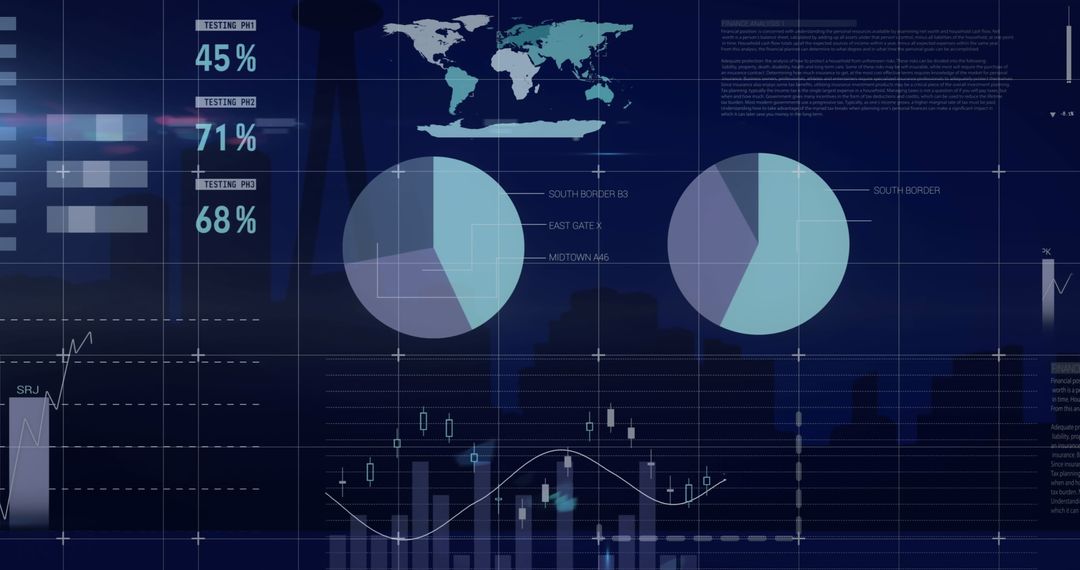
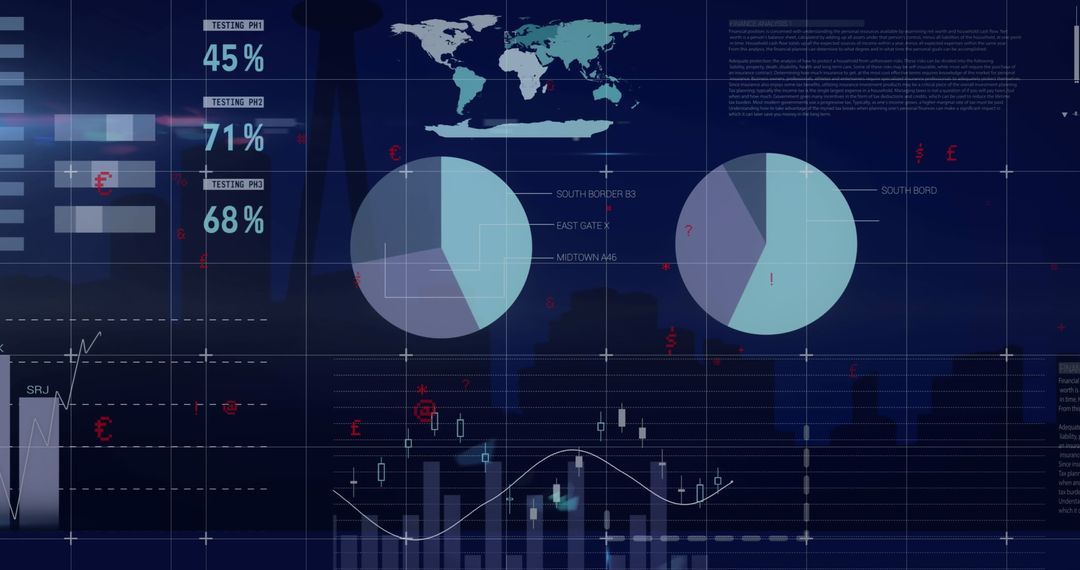
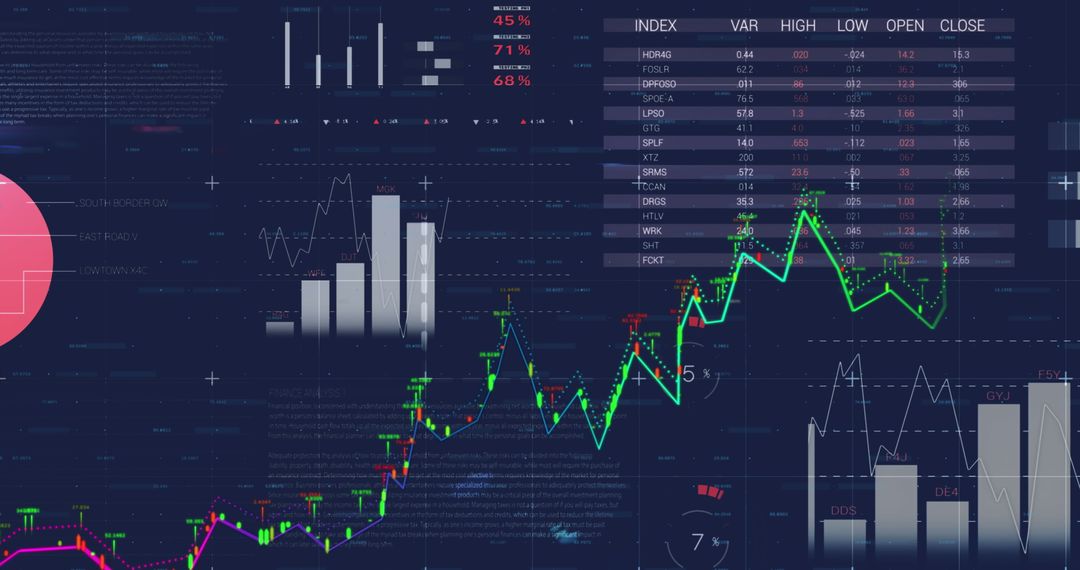
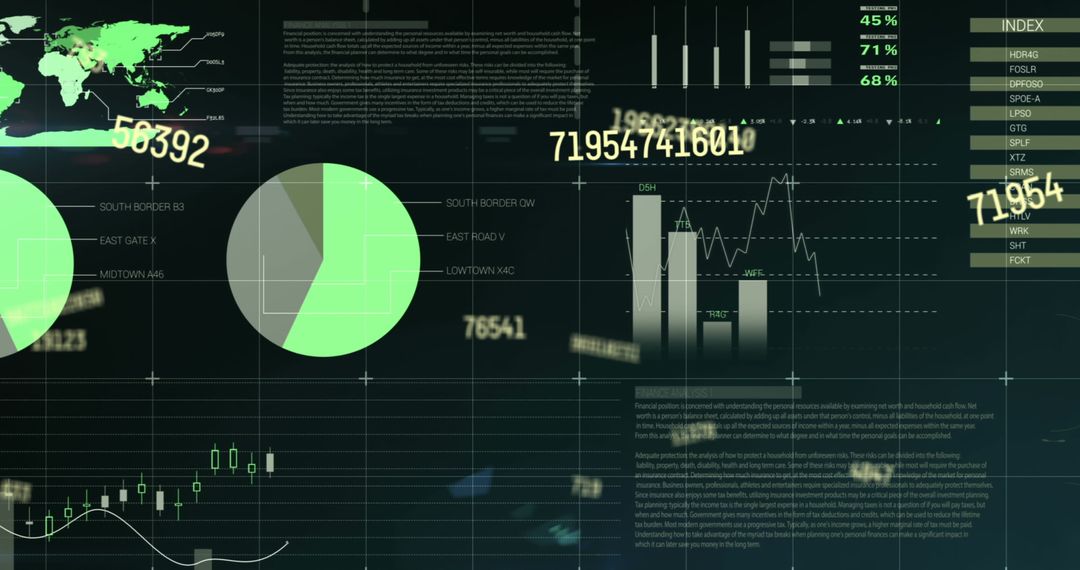
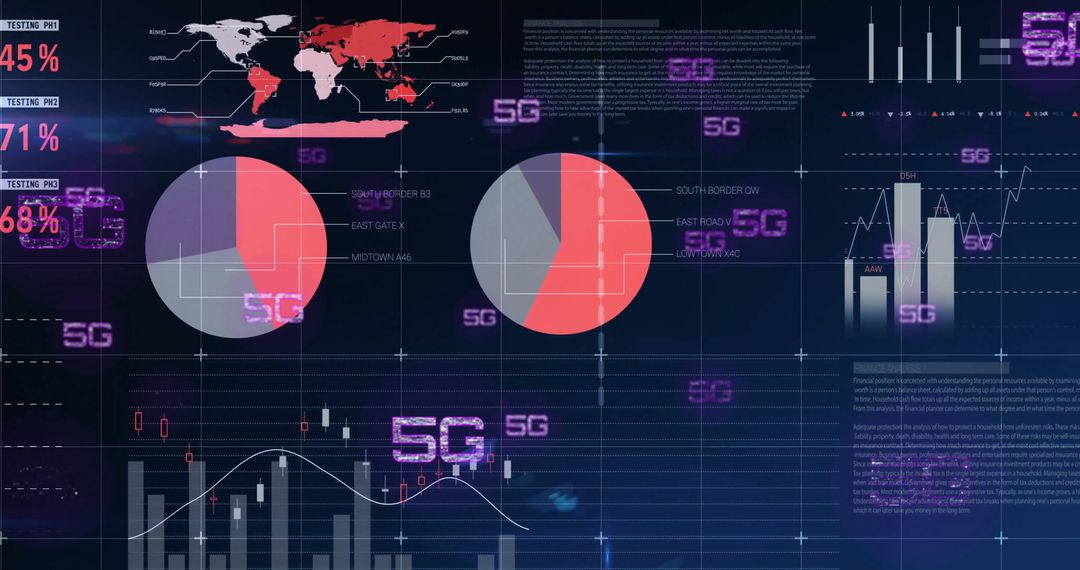
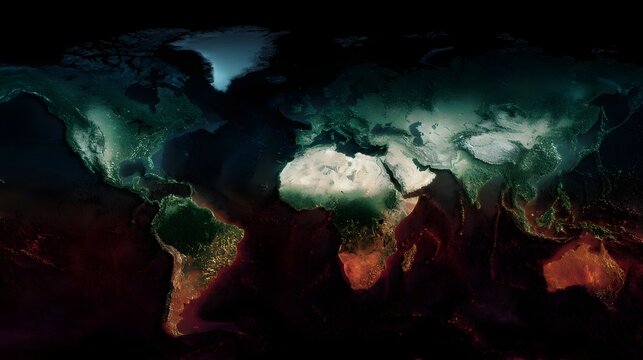
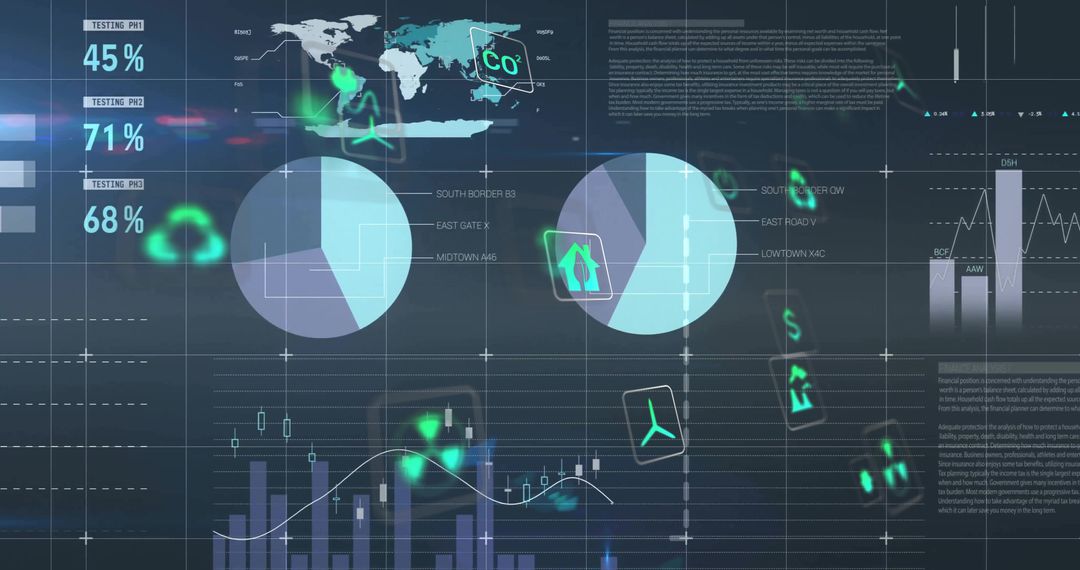
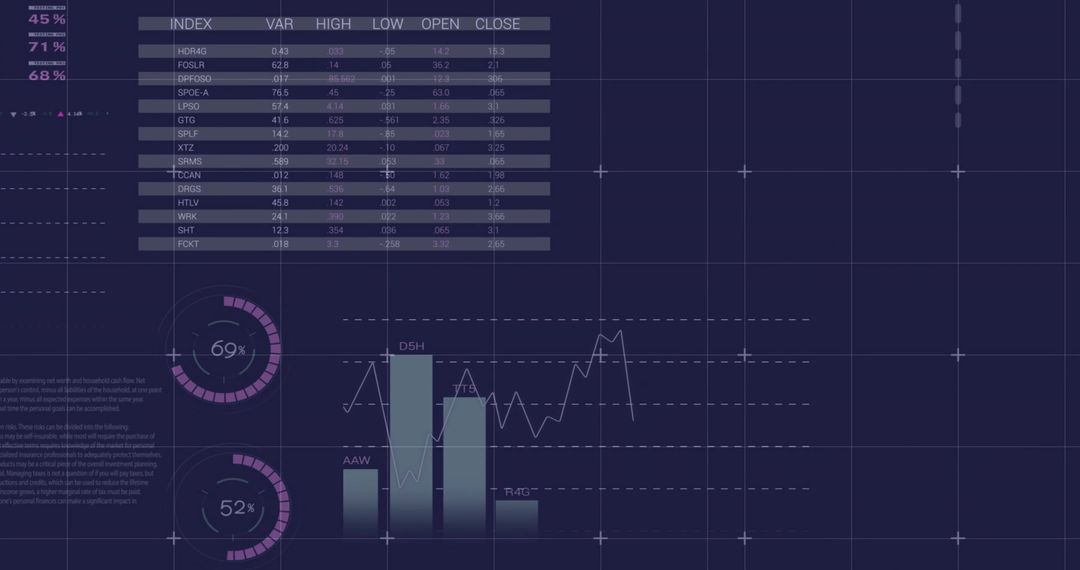
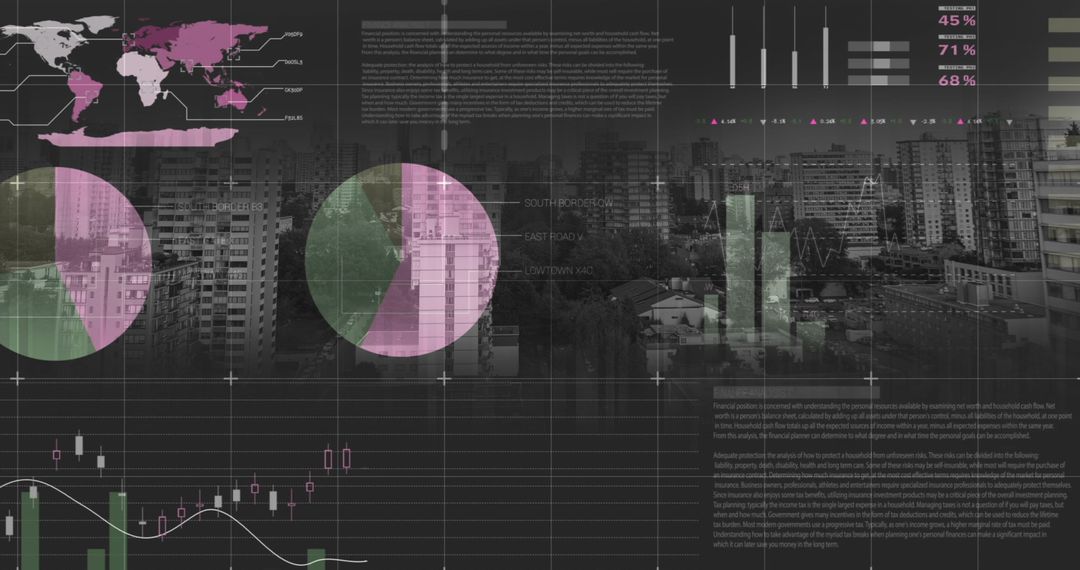
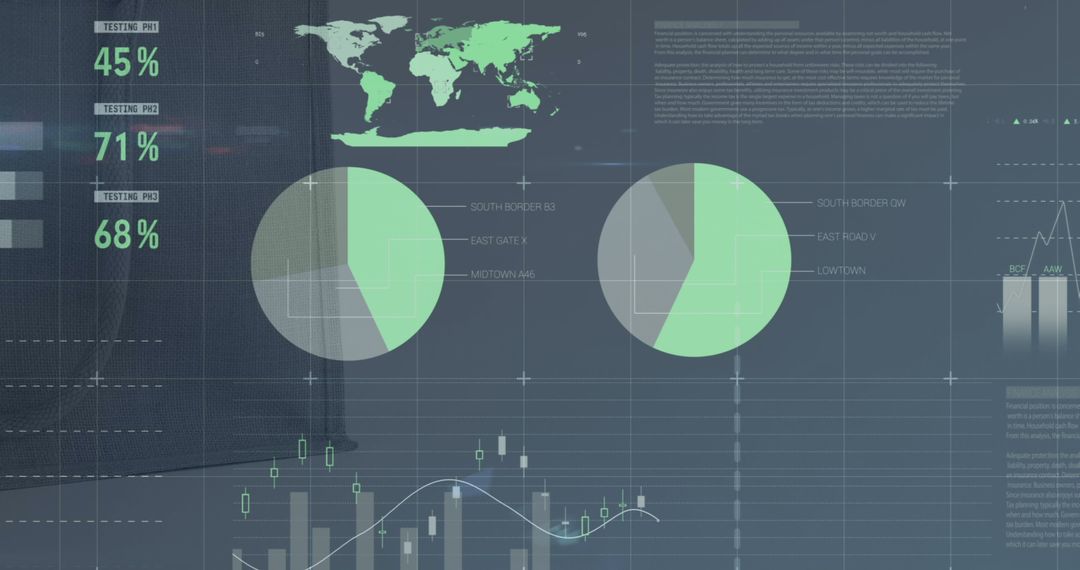
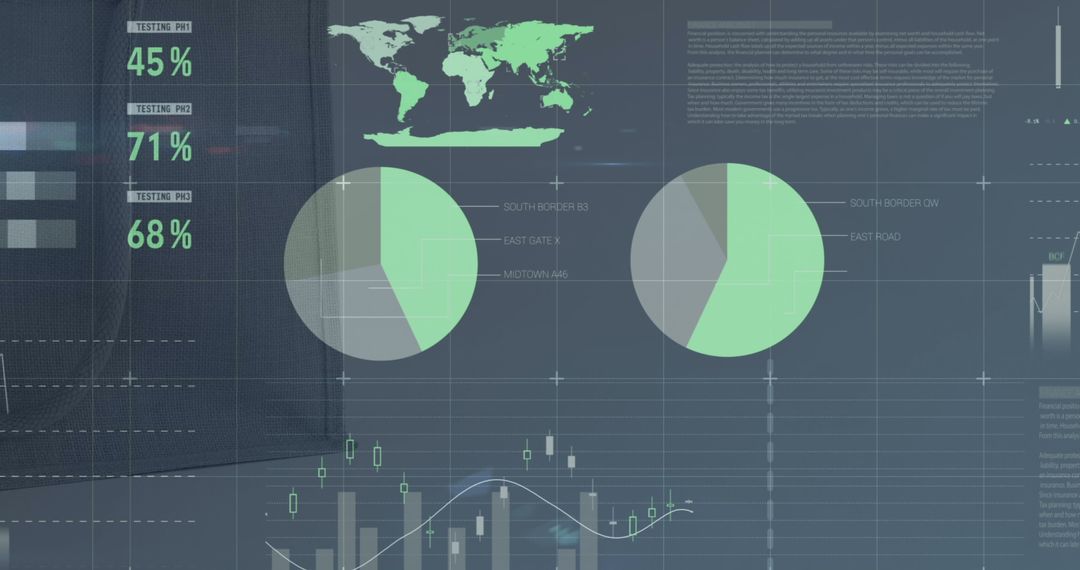
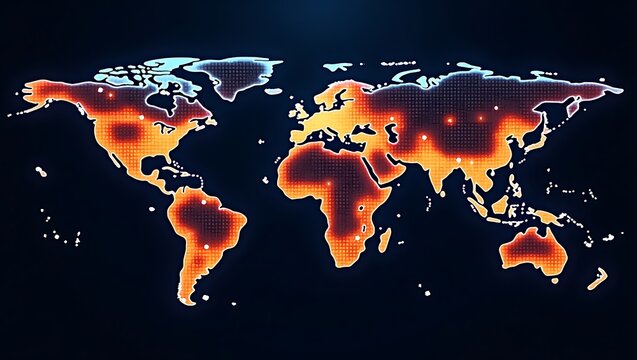
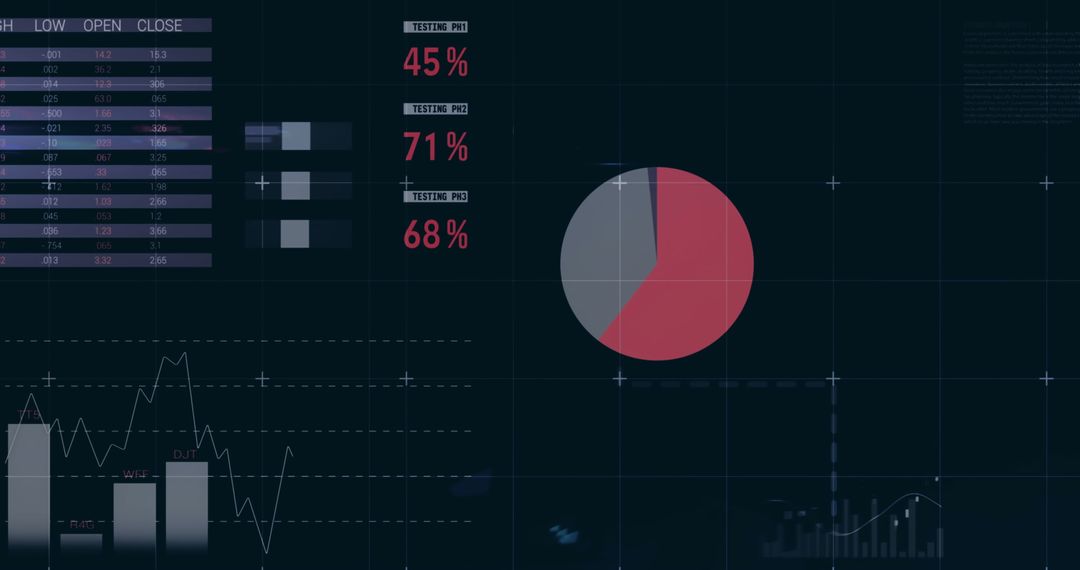
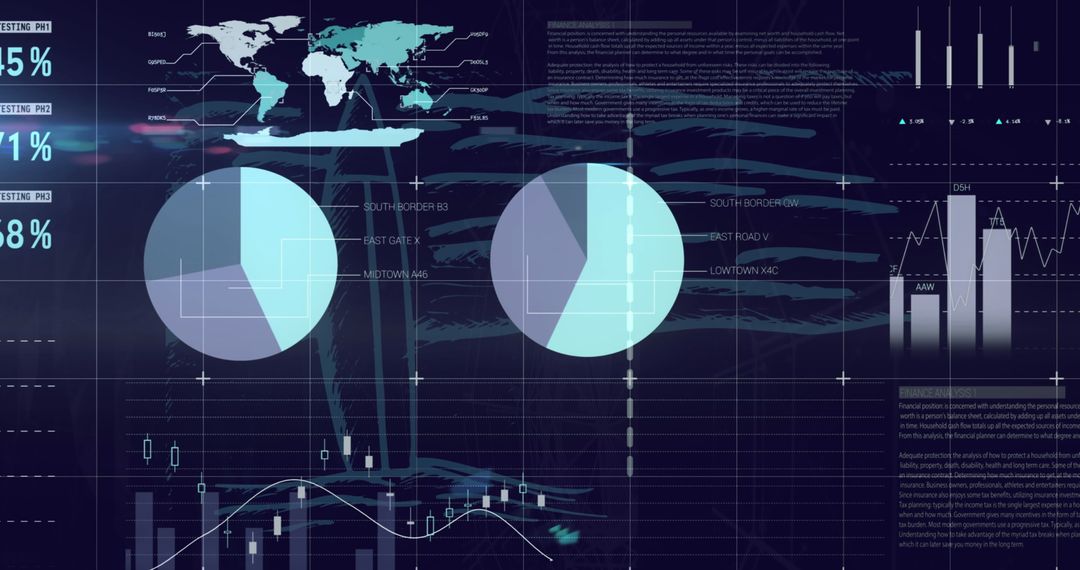
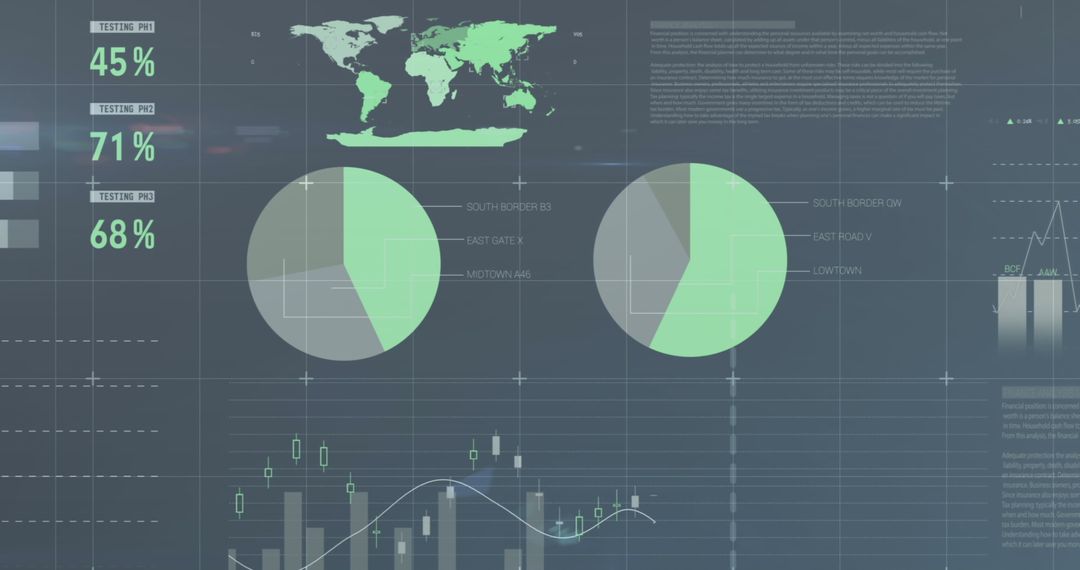
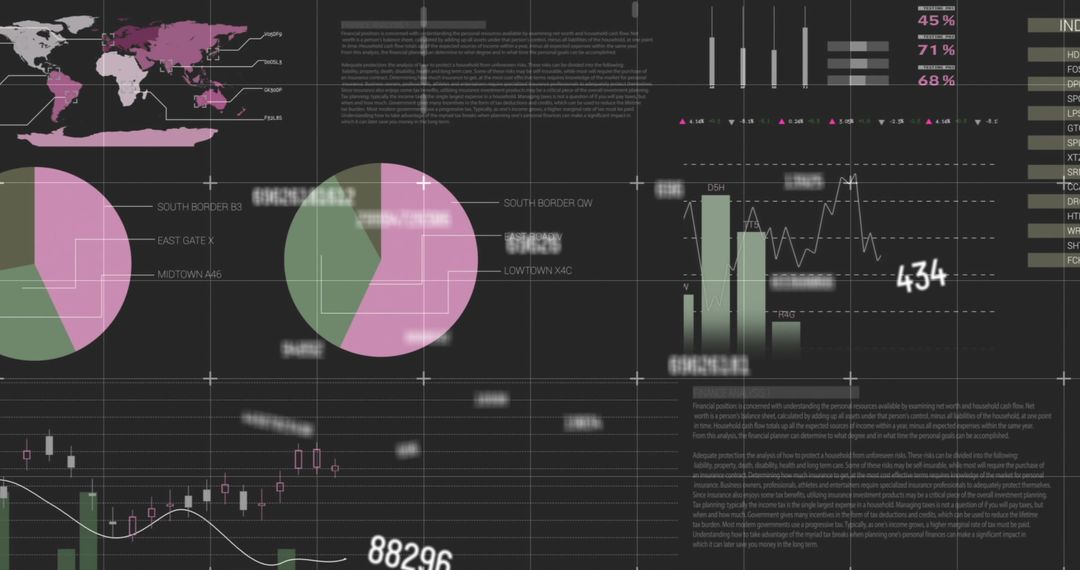
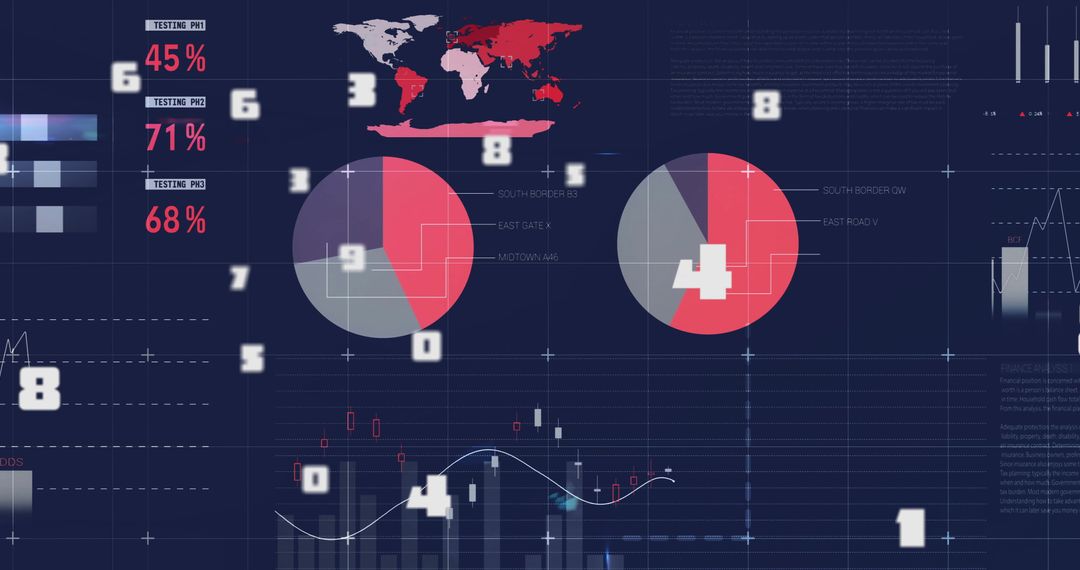
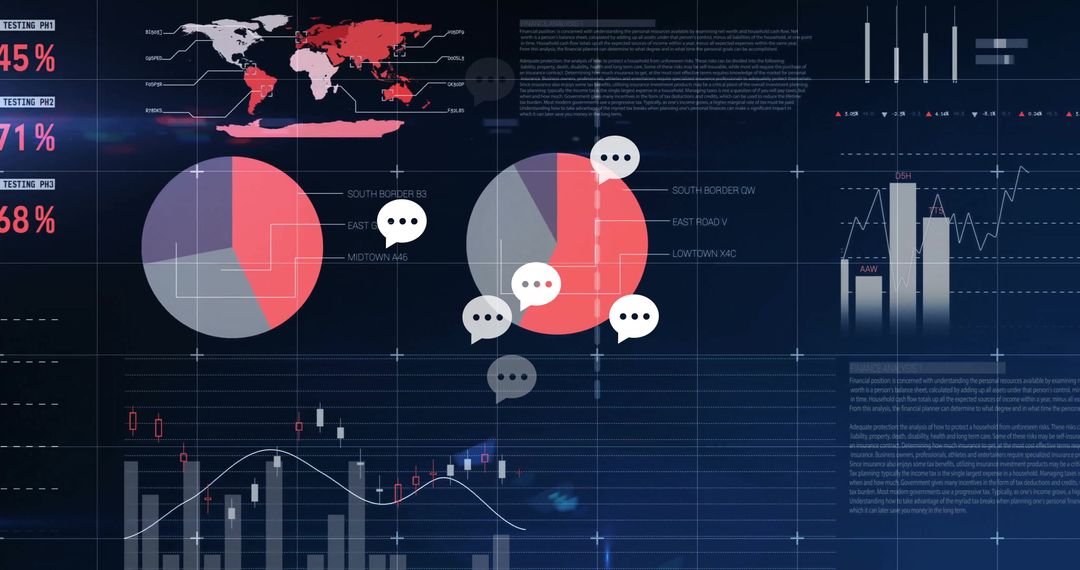
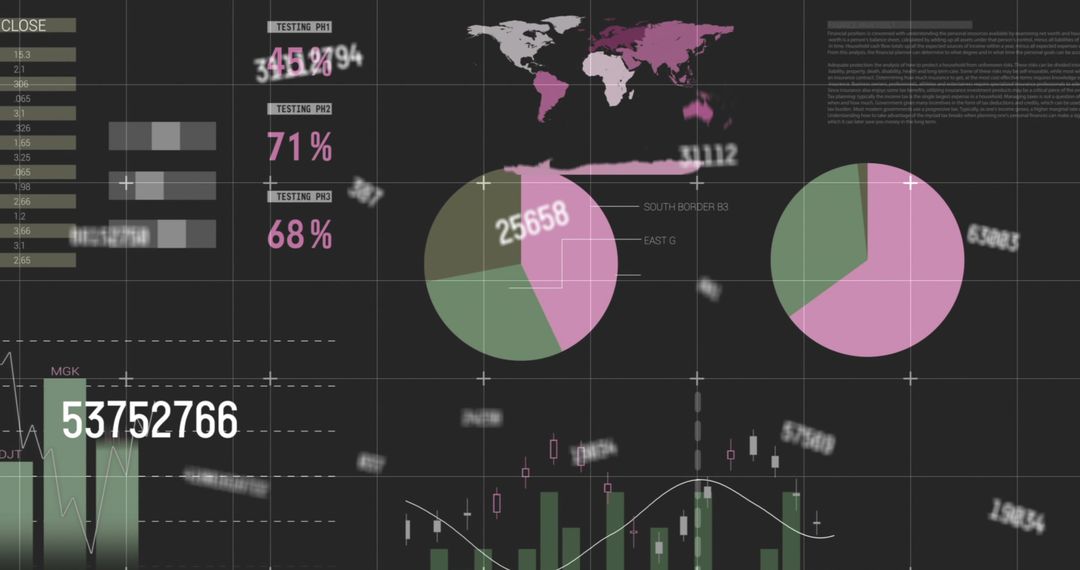
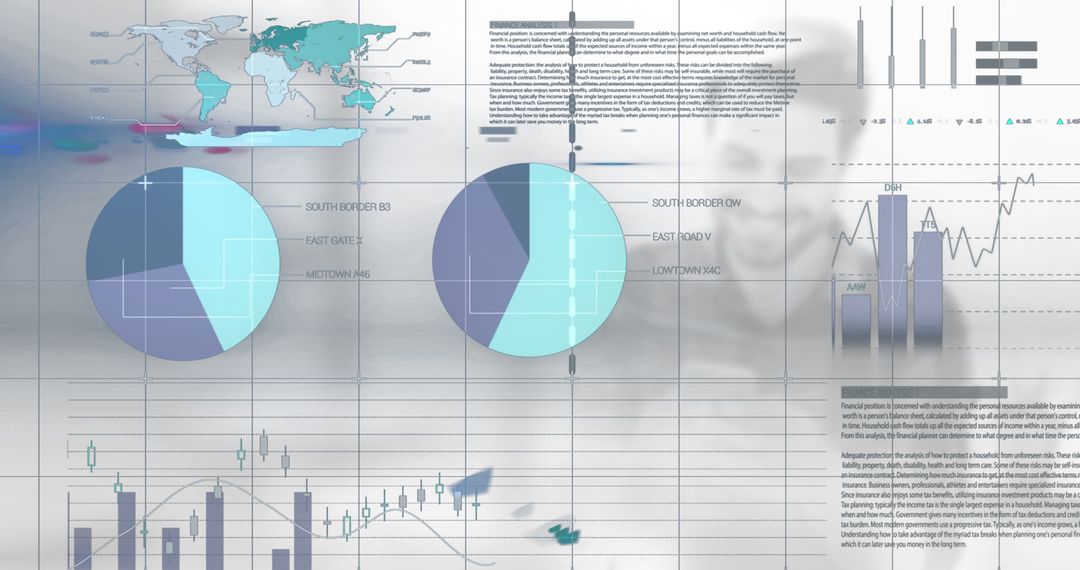
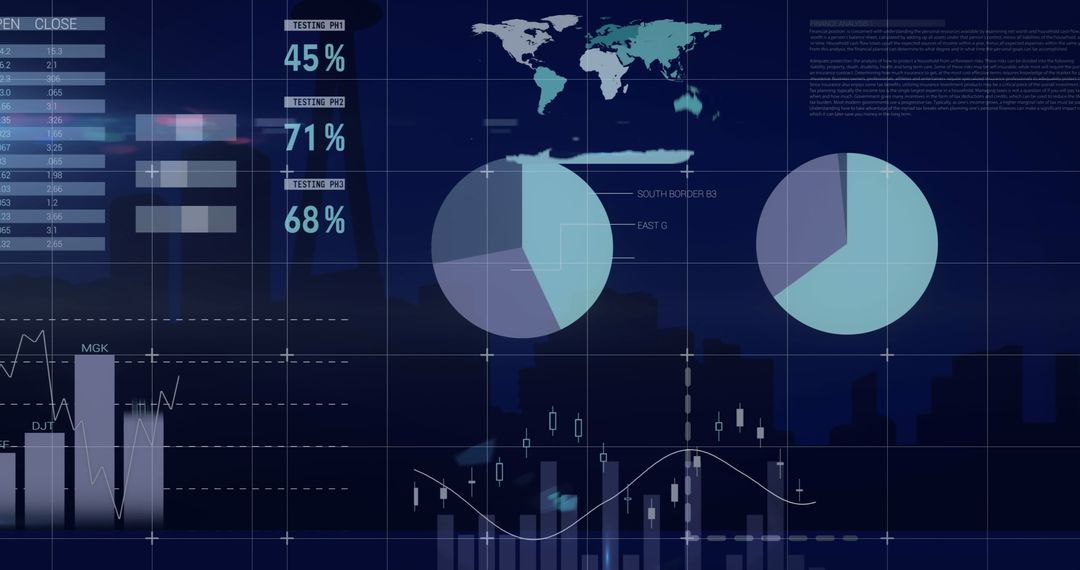
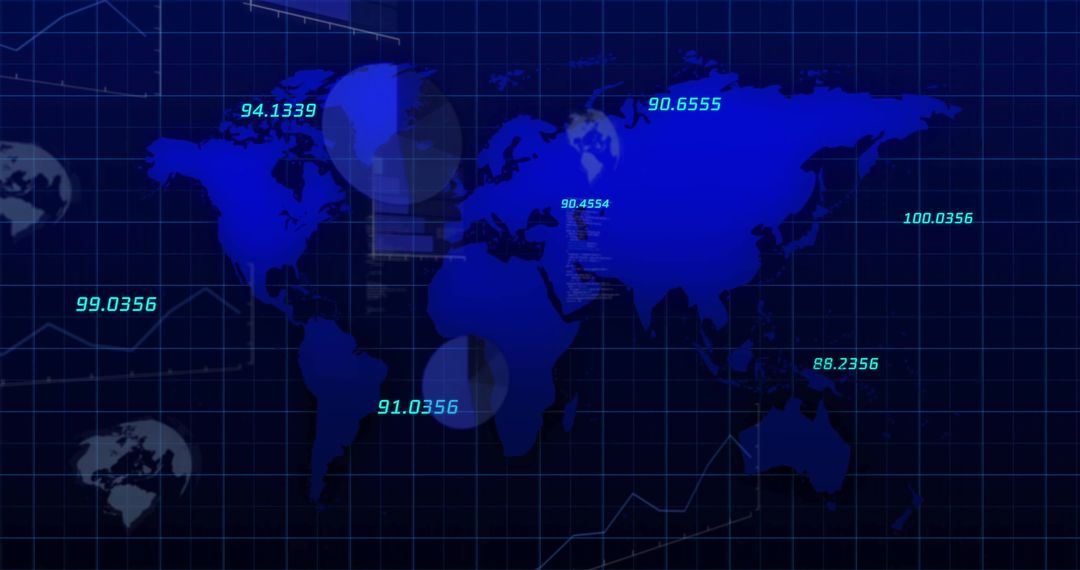
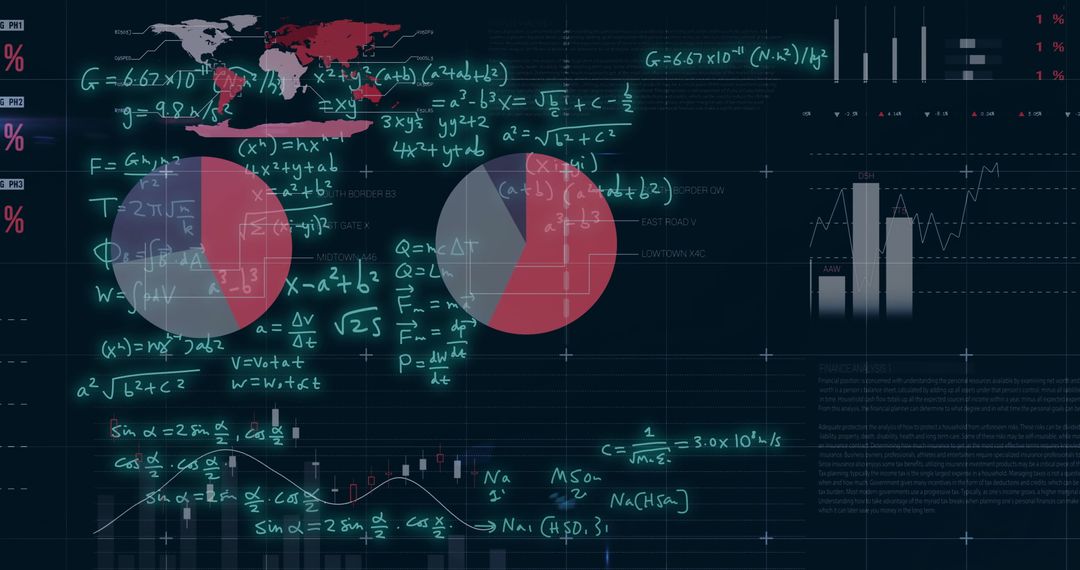
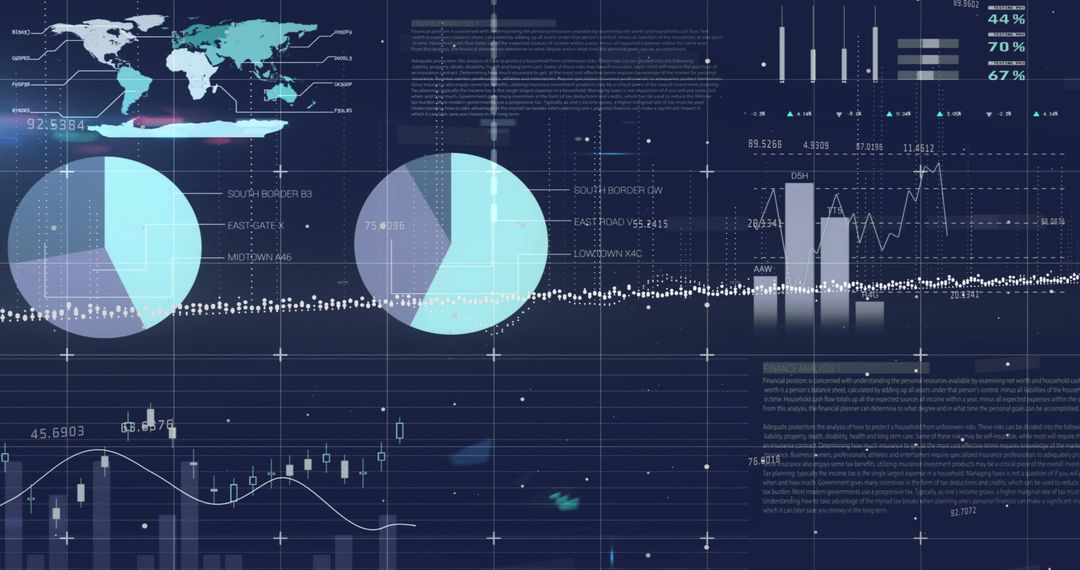
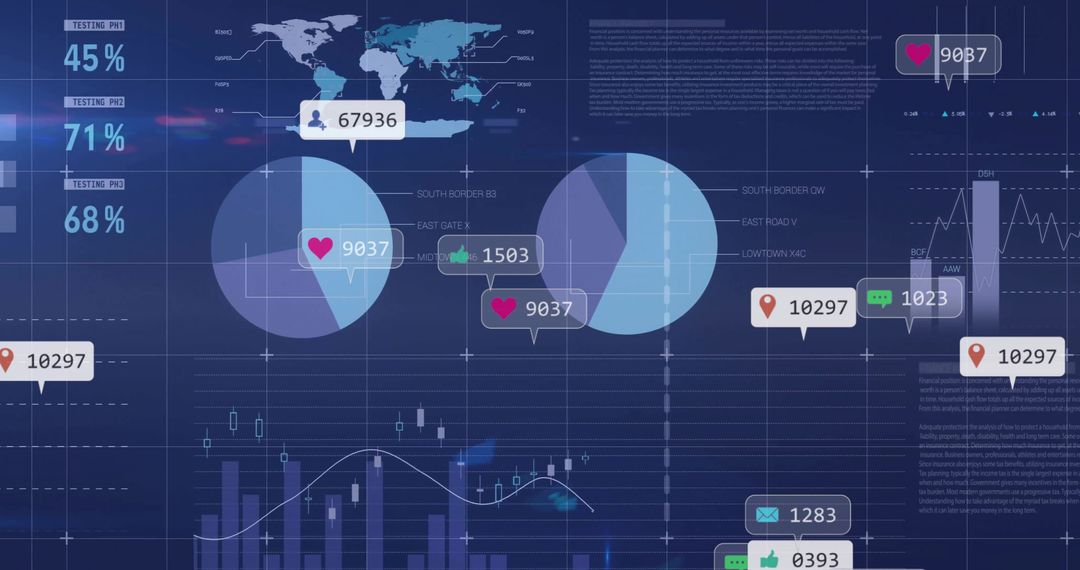
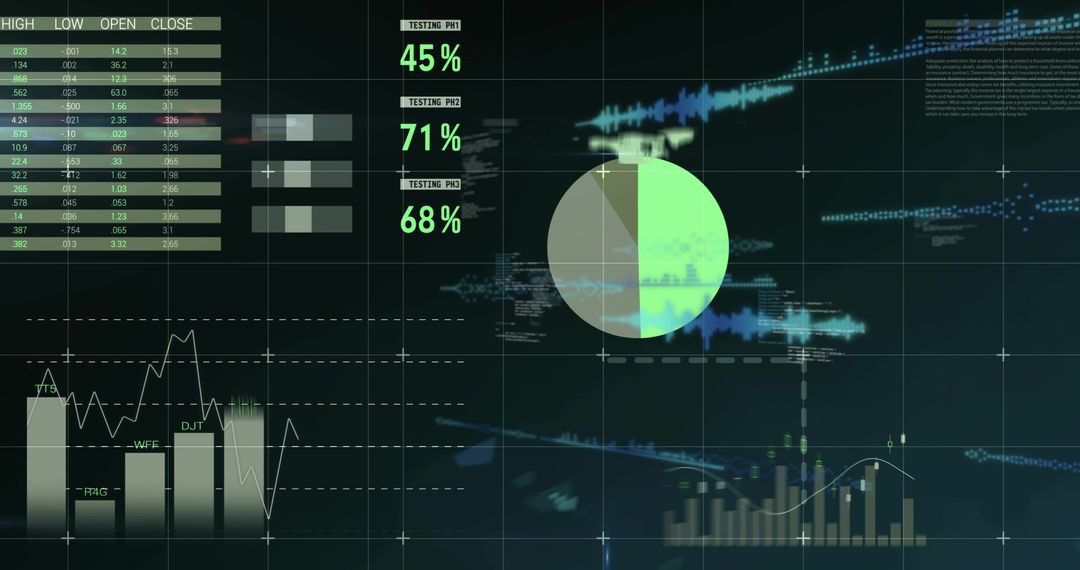
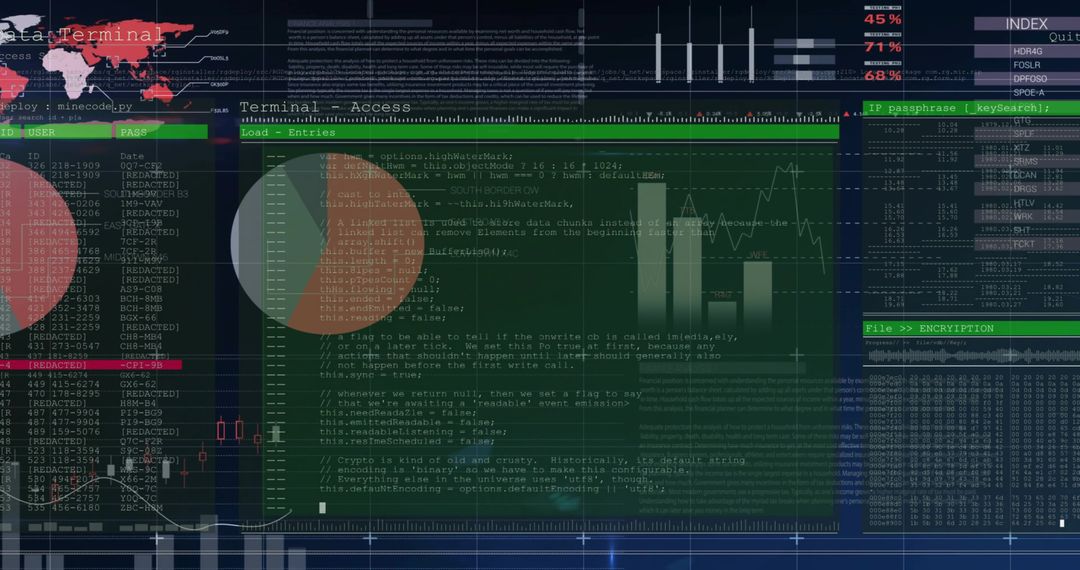
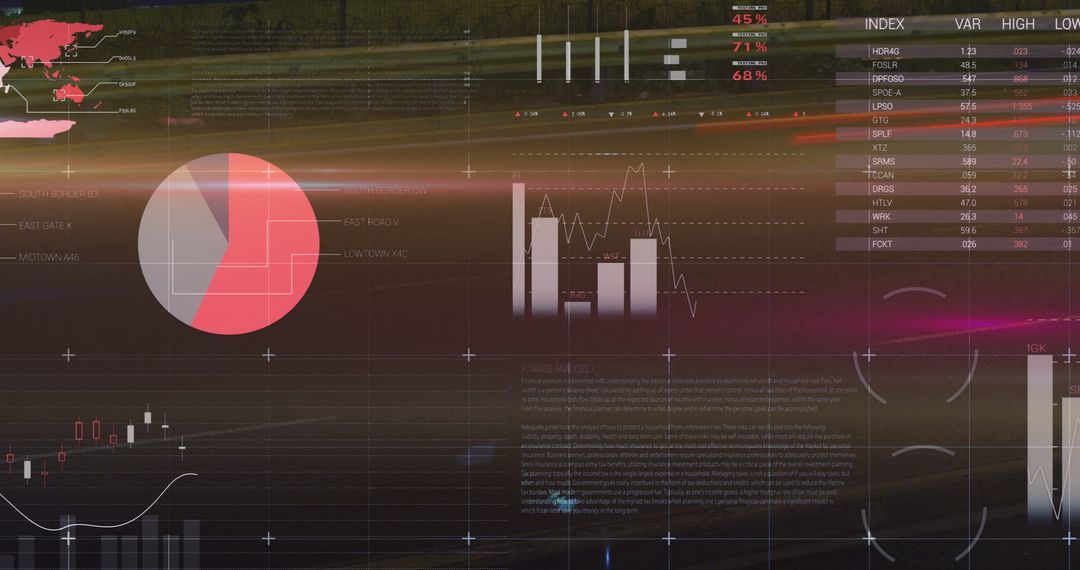
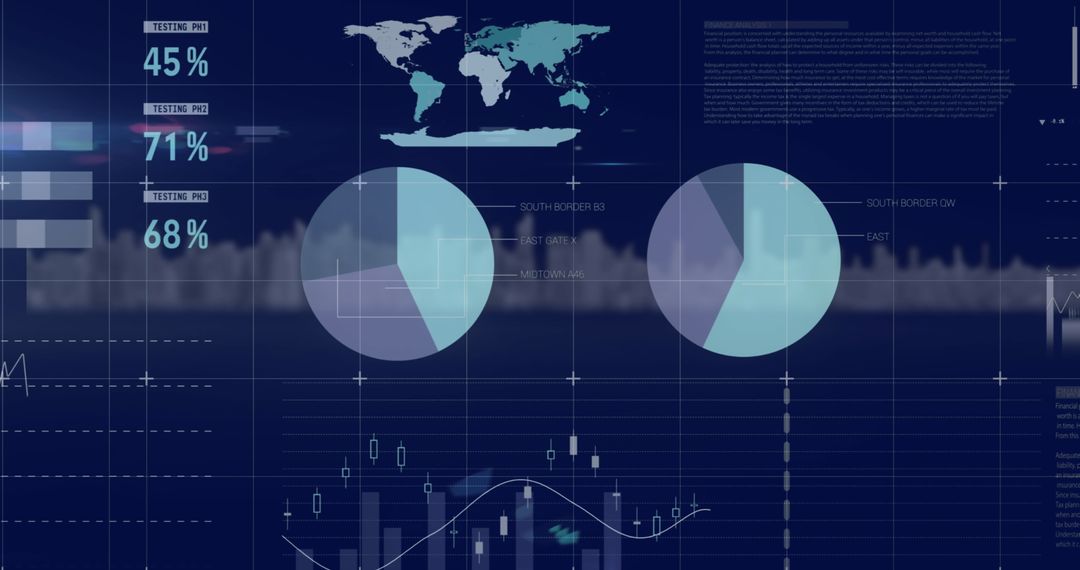
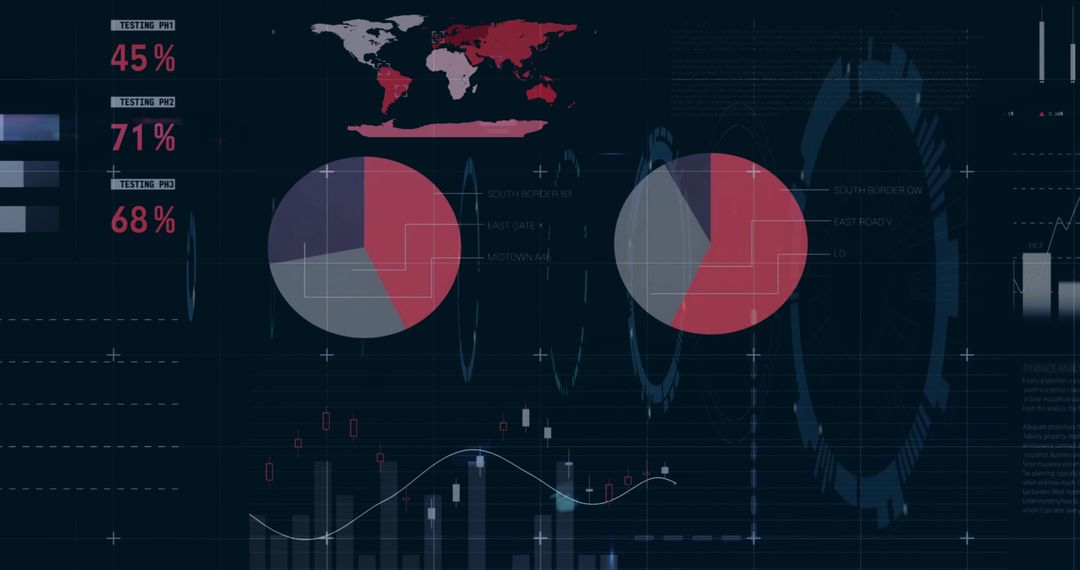
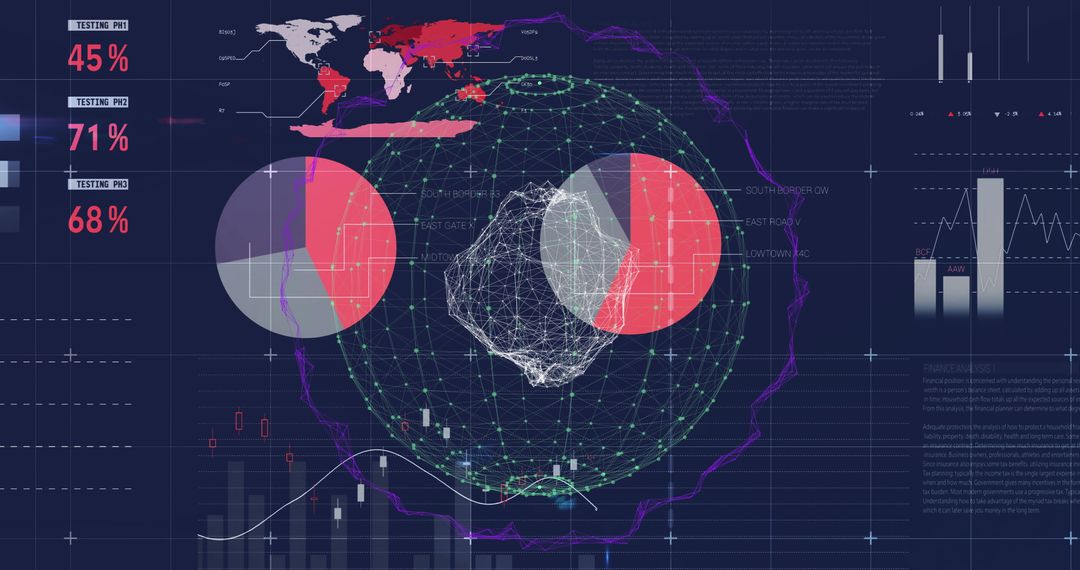
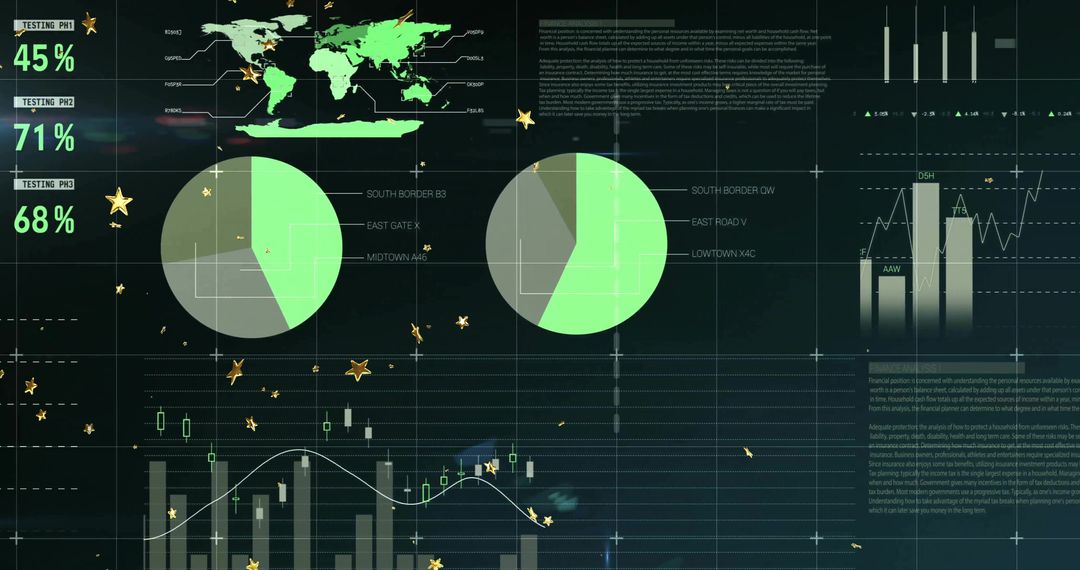
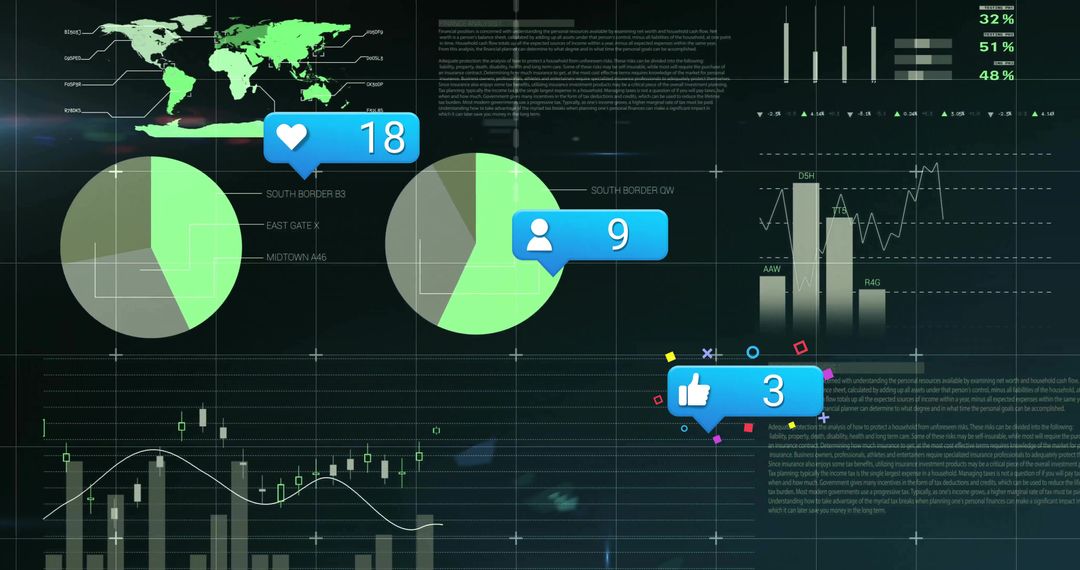
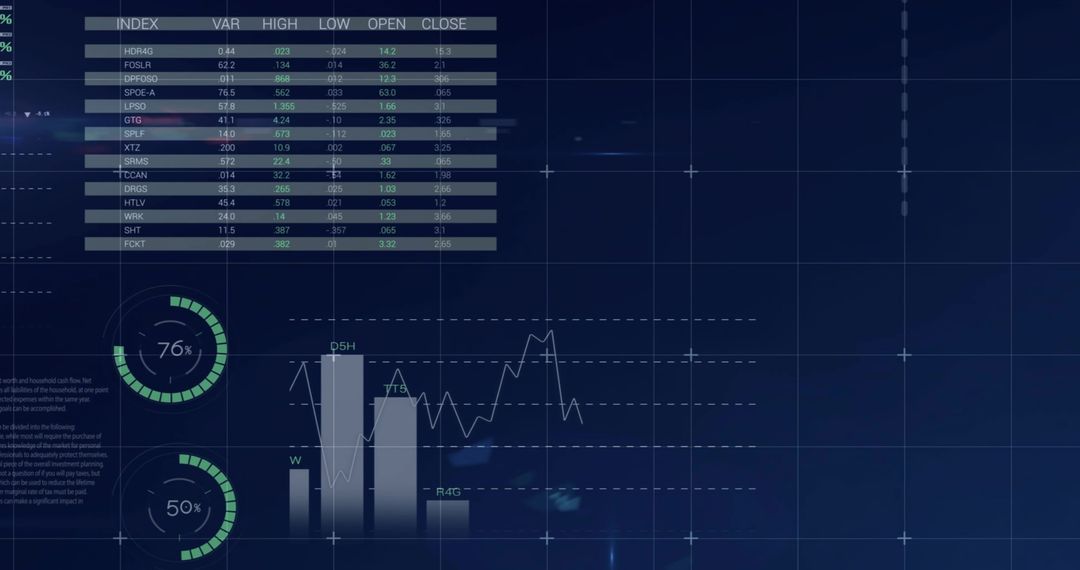
Showing glowing white cluster overlaying stylized global map with red heat circles, percentage metrics, candlestick graphs and bar charts. Combining geographic visualization with financial analytics and network monitoring to convey hotspots, anomaly detection and market activity. Fitting into corporate presentations, investor reports, cybersecurity briefings, data science articles, pitch decks and broadcast graphics. Providing room for overlaying custom logos, titles and data callouts. Working well as header art, background for dashboard mockups, slide covers and marketing collateral.
Powered by 


0
downloads
downloads
Tags:
More
Credit Photo
If you would like to credit the Photo, here are some ways you can do so
Text Link
photo Link
<span class="text-link">
<span>
<a target="_blank" href=https://pikwizard.com/photo/glowing-data-cluster-visualizing-global-network-heatmap-metrics-and-candlestick-charts/74b5bdd0116aae0bdc42943a54ac7f8c/>PikWizard</a>
</span>
</span>
<span class="image-link">
<span
style="margin: 0 0 20px 0; display: inline-block; vertical-align: middle; width: 100%;"
>
<a
target="_blank"
href="https://pikwizard.com/photo/glowing-data-cluster-visualizing-global-network-heatmap-metrics-and-candlestick-charts/74b5bdd0116aae0bdc42943a54ac7f8c/"
style="text-decoration: none; font-size: 10px; margin: 0;"
>
<img src="https://pikwizard.com/pw/medium/74b5bdd0116aae0bdc42943a54ac7f8c.jpg" style="margin: 0; width: 100%;" alt="" />
<p style="font-size: 12px; margin: 0;">PikWizard</p>
</a>
</span>
</span>
Free (free of charge)
Free for personal and commercial use.
Author: Creative Art
Similar Free Stock Images

Premium


Premium


Premium


Premium


Premium


Premium


Premium


Premium

Premium


Premium


Premium


Premium


Premium


Premium


Premium


Premium


Premium


Premium


Premium


Premium


Premium


Premium


Premium


Premium