- Home >
- Stock Photos >
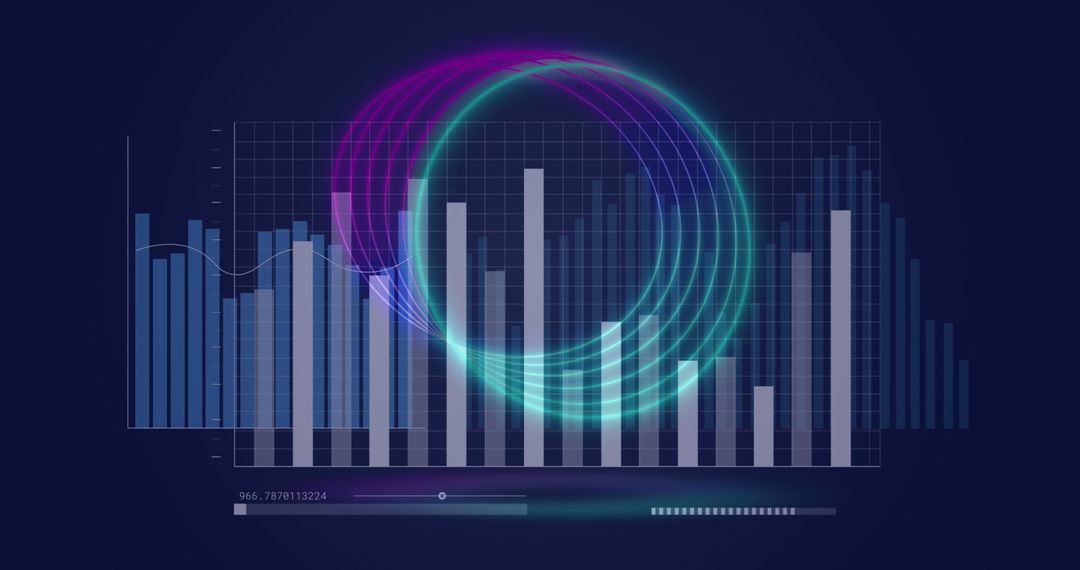
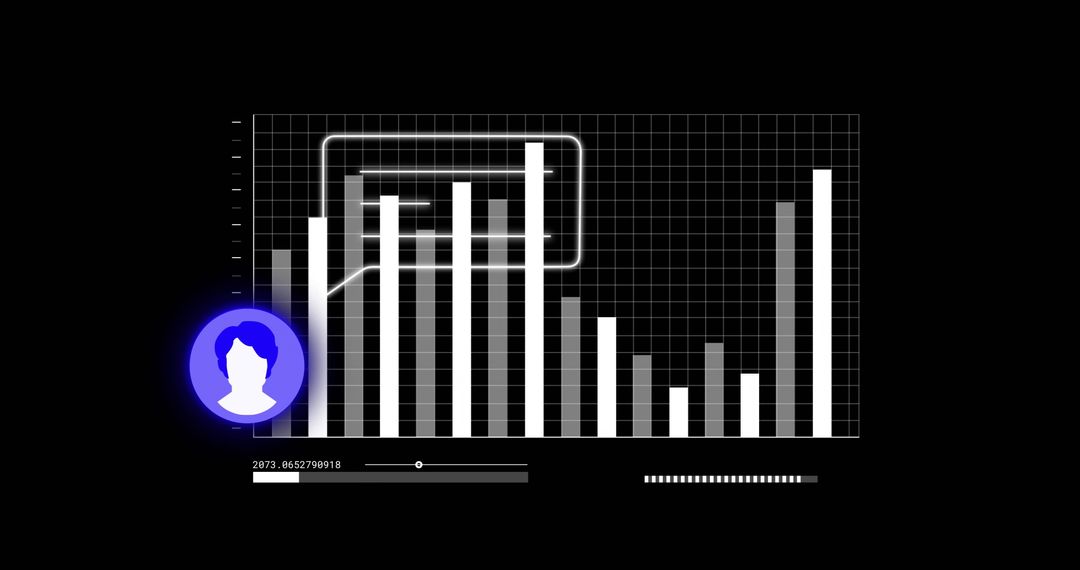
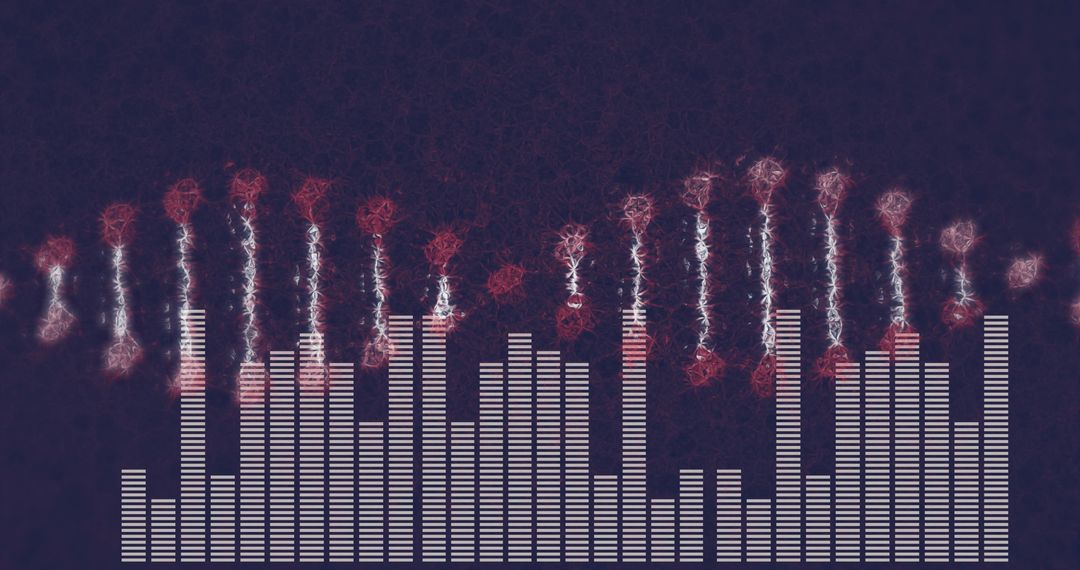
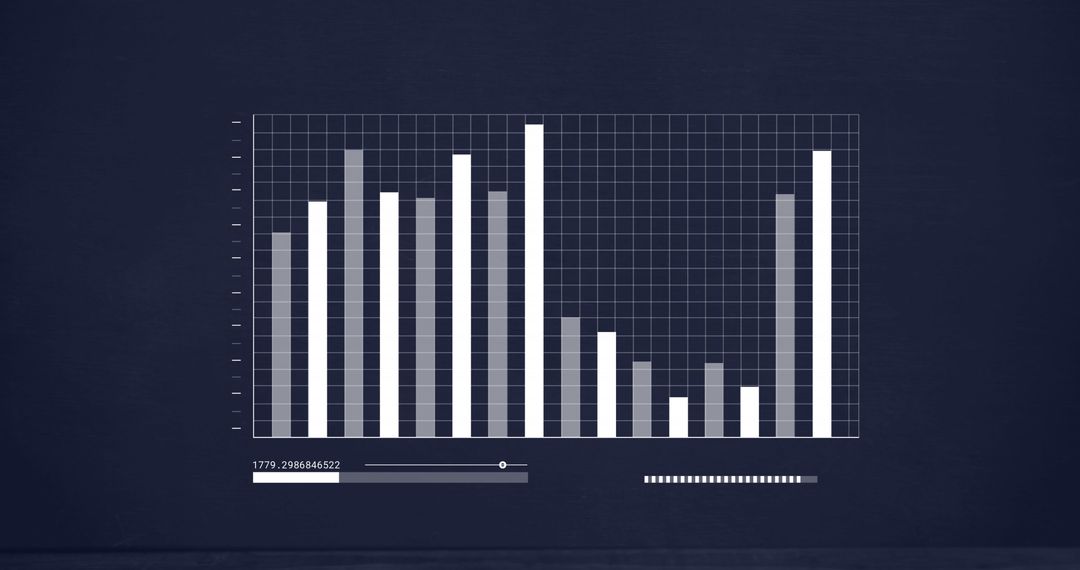
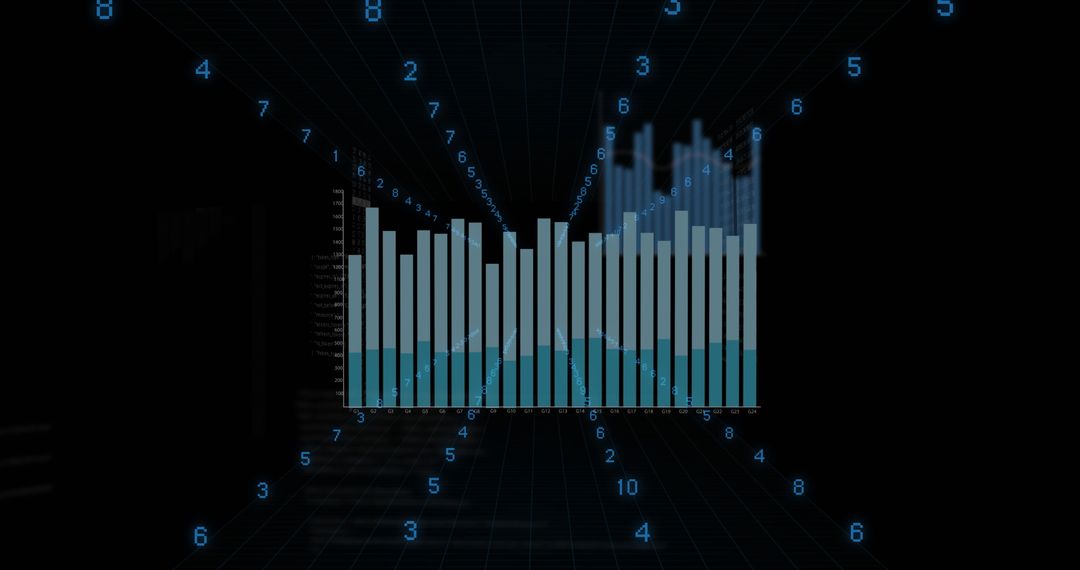
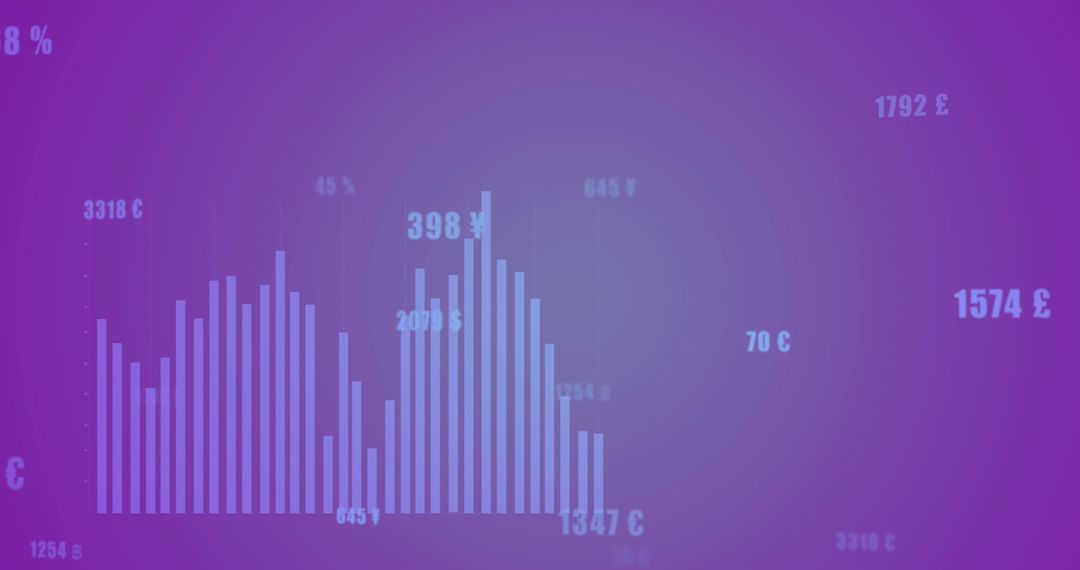
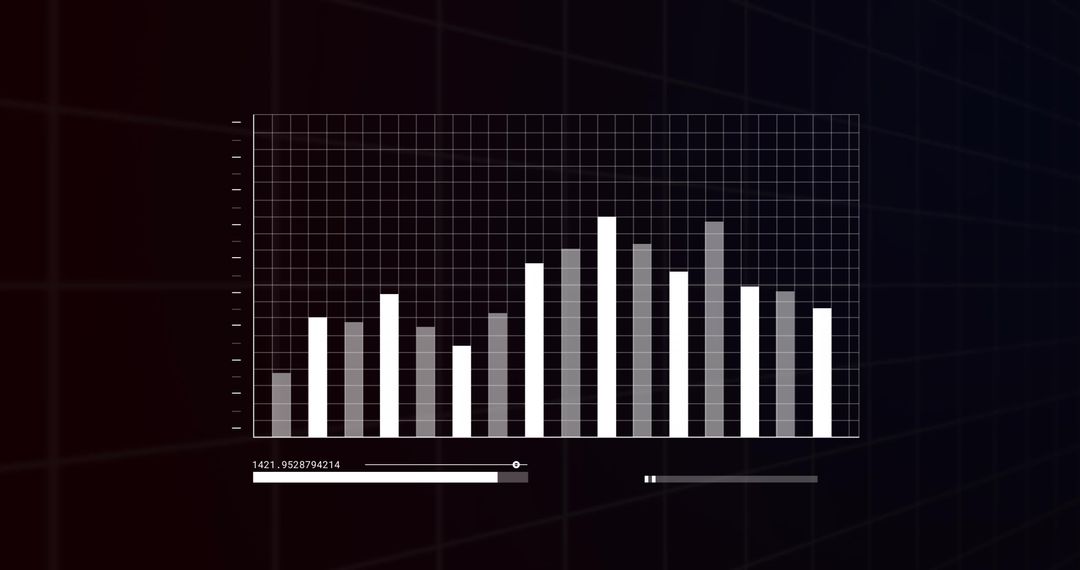
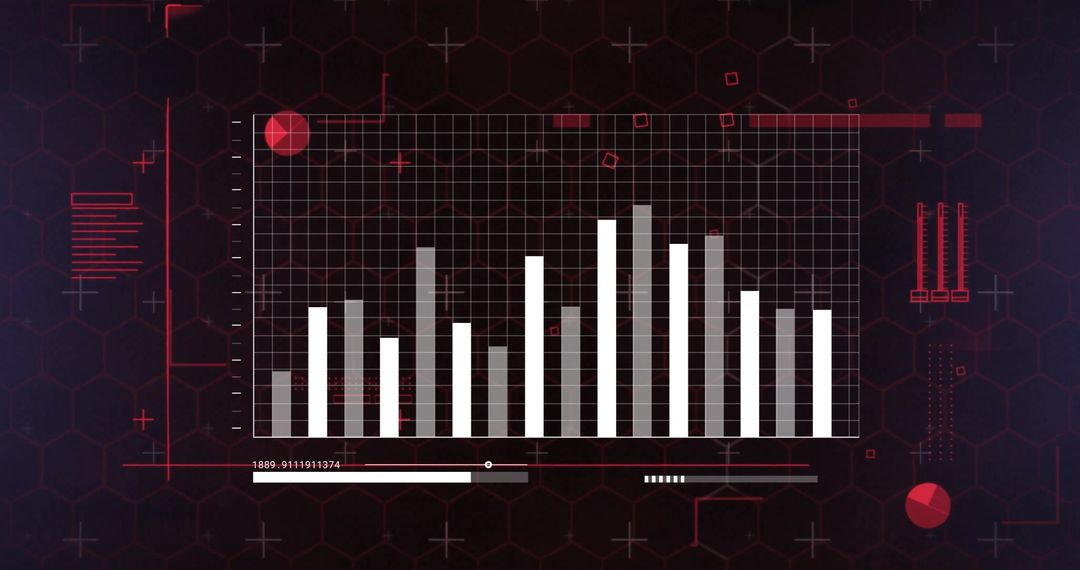
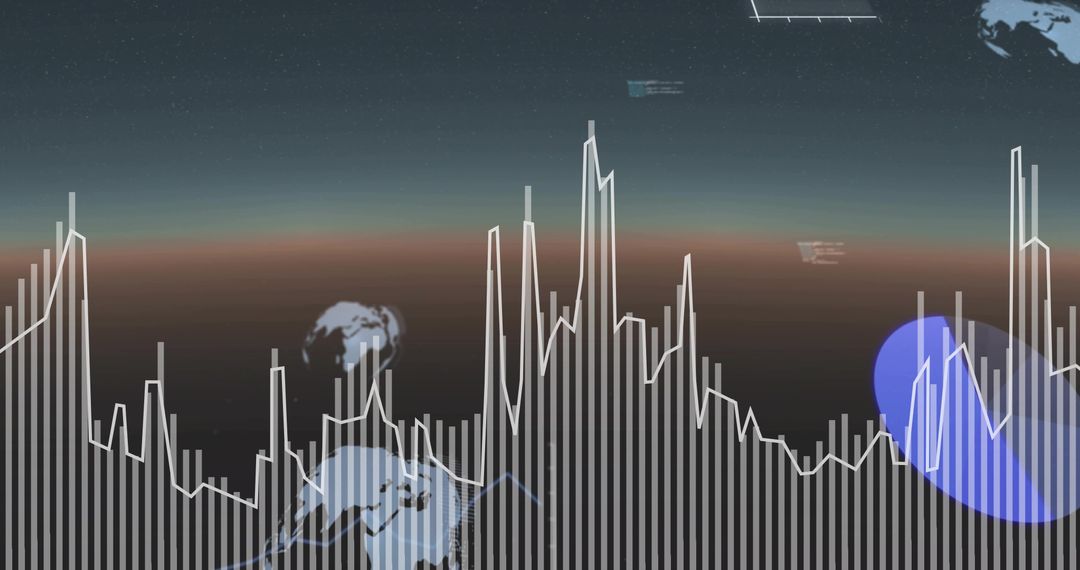
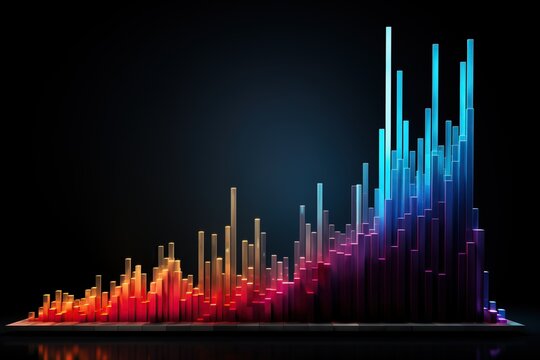
- Glowing Digital Bar Chart Dashboard with Bokeh Particles, Grid Overlay and Data Sliders
Glowing Digital Bar Chart Dashboard with Bokeh Particles, Grid Overlay and Data Sliders Image

Showing glowing bar chart on dark gradient background with golden bokeh particles, grid overlay, and horizontal sliders. White and gray bars contrasting against rich purple-black gradient, creating modern tech aesthetic. Ideal for presenting analytics dashboards, KPI reports, fintech visuals, business presentations, SaaS marketing, and website hero banners. Working well for slide deck cover, blog header, social media campaign, pitch deck, annual report, and product landing page. Easy to combine with overlay text, logo, or data highlights for polished professional look.
Powered by 


0
downloads
downloads
Tags:
More
Credit Photo
If you would like to credit the Photo, here are some ways you can do so
Text Link
photo Link
<span class="text-link">
<span>
<a target="_blank" href=https://pikwizard.com/photo/glowing-digital-bar-chart-dashboard-with-bokeh-particles-grid-overlay-and-data-sliders/d6e97d2b9ddda1cf668feaf2335f2b2e/>PikWizard</a>
</span>
</span>
<span class="image-link">
<span
style="margin: 0 0 20px 0; display: inline-block; vertical-align: middle; width: 100%;"
>
<a
target="_blank"
href="https://pikwizard.com/photo/glowing-digital-bar-chart-dashboard-with-bokeh-particles-grid-overlay-and-data-sliders/d6e97d2b9ddda1cf668feaf2335f2b2e/"
style="text-decoration: none; font-size: 10px; margin: 0;"
>
<img src="https://pikwizard.com/pw/medium/d6e97d2b9ddda1cf668feaf2335f2b2e.jpg" style="margin: 0; width: 100%;" alt="" />
<p style="font-size: 12px; margin: 0;">PikWizard</p>
</a>
</span>
</span>
Free (free of charge)
Free for personal and commercial use.
Author: Authentic Images
Similar Free Stock Images

Premium


Premium


Premium


Premium


Premium


Premium


Premium


Premium


Premium


Premium


Premium


Premium


Premium


Premium


Premium


Premium

Premium


Premium


Premium


Premium


Premium


Premium


Premium


Premium