- Home >
- Stock Photos >
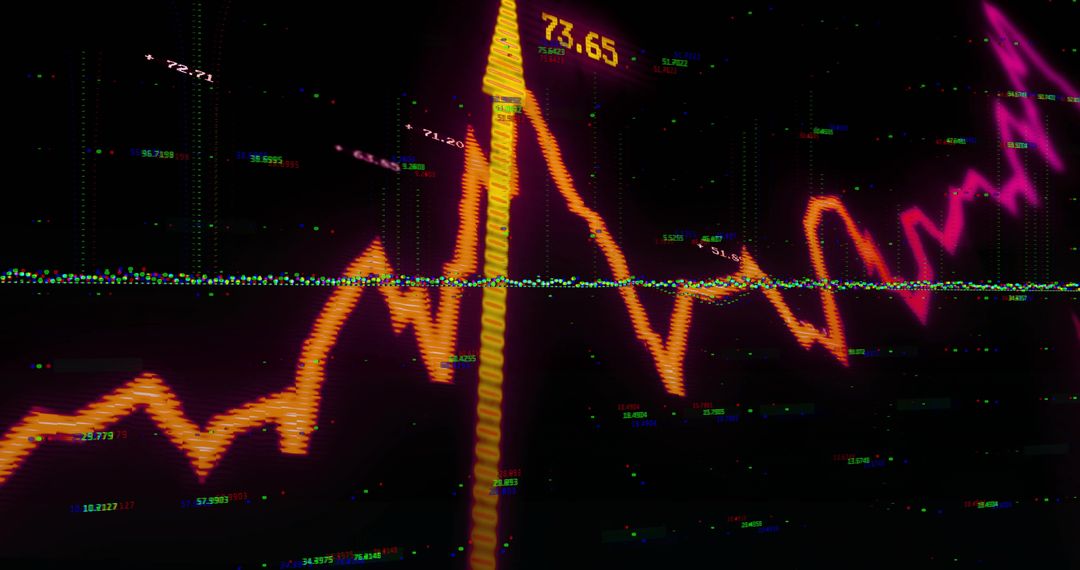
- Glowing Financial Graph of Stock Market Trends on Digital Screen
Glowing Financial Graph of Stock Market Trends on Digital Screen Image

A digital representation of stock market fluctuations shown through a glowing financial graph. Useful for finance or investment articles, illustrating economic trends or tools supporting market forecasting. Great for websites focused on trading, economics, and investor information.
Powered by  - Get 15% off with code: PIKWIZARD15


2
downloads
downloads
Tags:
More
Credit Photo
If you would like to credit the Photo, here are some ways you can do so
Text Link
photo Link
<span class="text-link">
<span>
<a target="_blank" href=https://pikwizard.com/photo/glowing-financial-graph-of-stock-market-trends-on-digital-screen/01d24bab1bbe4247de0ad67c062df2e8/>PikWizard</a>
</span>
</span>
<span class="image-link">
<span
style="margin: 0 0 20px 0; display: inline-block; vertical-align: middle; width: 100%;"
>
<a
target="_blank"
href="https://pikwizard.com/photo/glowing-financial-graph-of-stock-market-trends-on-digital-screen/01d24bab1bbe4247de0ad67c062df2e8/"
style="text-decoration: none; font-size: 10px; margin: 0;"
>
<img src="https://pikwizard.com/pw/medium/01d24bab1bbe4247de0ad67c062df2e8.jpg" style="margin: 0; width: 100%;" alt="" />
<p style="font-size: 12px; margin: 0;">PikWizard</p>
</a>
</span>
</span>
Free (free of charge)
Free for personal and commercial use.
Author: People Creations
Similar Free Stock Images

Premium


Premium


Premium


Premium


Premium


Premium


Premium


Premium


Premium


Premium


Premium


Premium


Premium


Premium


Premium


Premium


Premium


Premium


Premium


Premium


Premium


Premium


Premium


Premium