- Home >
- Stock Photos >
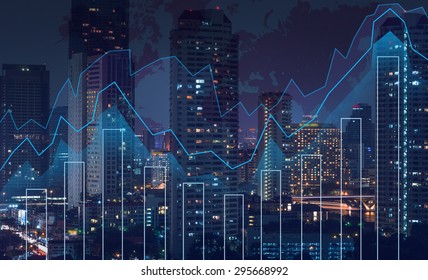
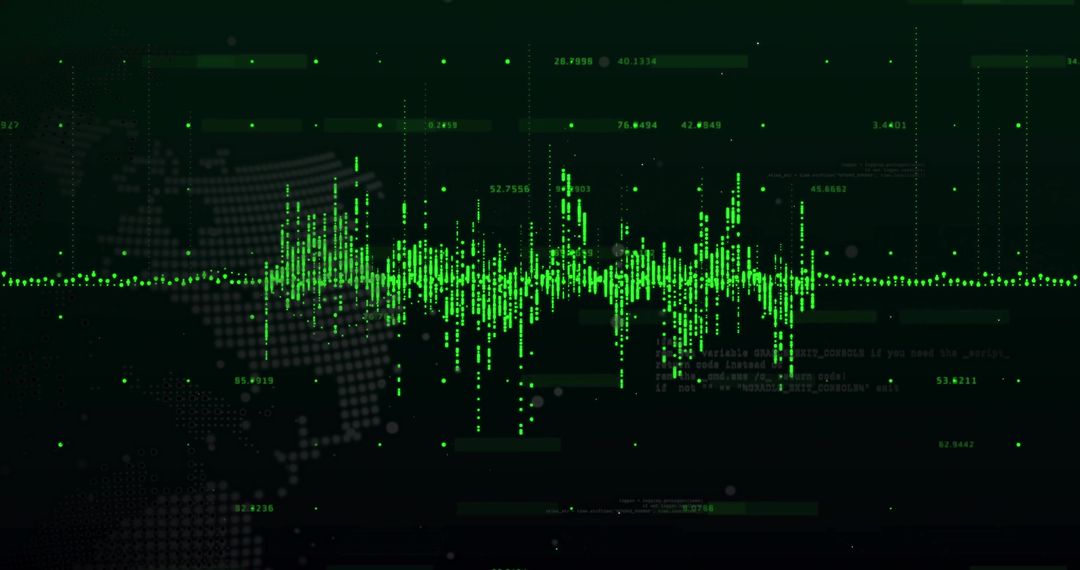
- Glowing Financial Graph with World Map in Dark Background
Glowing Financial Graph with World Map in Dark Background Image

Glowing green lines form a financial graph against a dark world map background, representing global trading trends and market data analysis. Useful for business presentations, financial reports, or technology themes related to worldwide investment analysis.
Powered by  - Get 15% off with code: PIKWIZARD15


2
downloads
downloads
Tags:
More
Credit Photo
If you would like to credit the Photo, here are some ways you can do so
Text Link
photo Link
<span class="text-link">
<span>
<a target="_blank" href=https://pikwizard.com/photo/glowing-financial-graph-with-world-map-in-dark-background/89e573535c093c9aa72395e4bf7a850e/>PikWizard</a>
</span>
</span>
<span class="image-link">
<span
style="margin: 0 0 20px 0; display: inline-block; vertical-align: middle; width: 100%;"
>
<a
target="_blank"
href="https://pikwizard.com/photo/glowing-financial-graph-with-world-map-in-dark-background/89e573535c093c9aa72395e4bf7a850e/"
style="text-decoration: none; font-size: 10px; margin: 0;"
>
<img src="https://pikwizard.com/pw/medium/89e573535c093c9aa72395e4bf7a850e.jpg" style="margin: 0; width: 100%;" alt="" />
<p style="font-size: 12px; margin: 0;">PikWizard</p>
</a>
</span>
</span>
Free (free of charge)
Free for personal and commercial use.
Author: Creative Art
Similar Free Stock Images
Premium


Premium


Premium


Premium


Premium


Premium


Premium


Premium


Premium


Premium


Premium


Premium


Premium


Premium


Premium


Premium


Premium


Premium


Premium


Premium


Premium


Premium


Premium


Premium