- Home >
- Stock Photos >
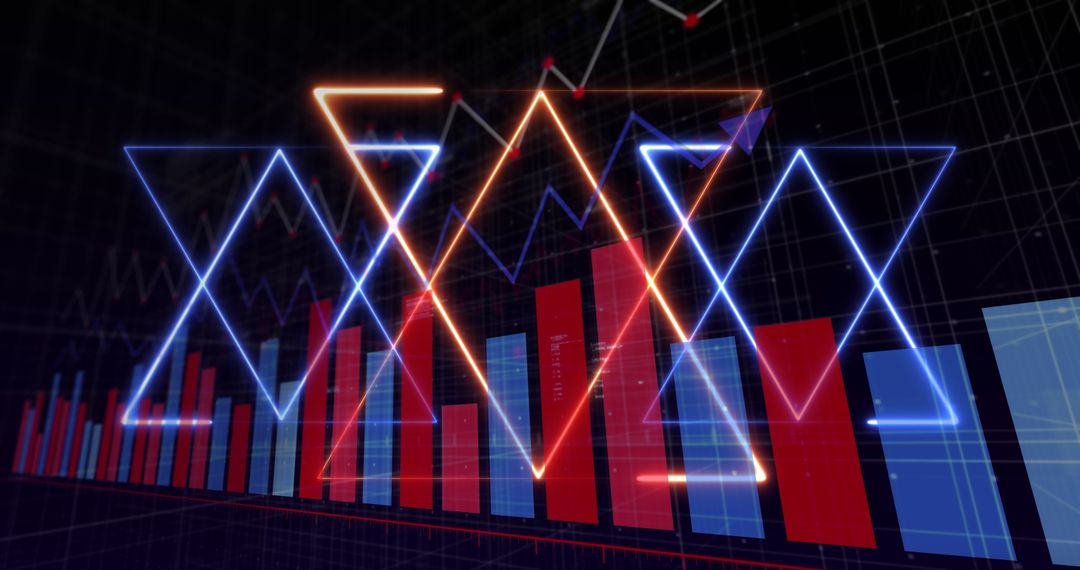
- Glowing Geometric Shapes with Financial Data Visualization
Glowing Geometric Shapes with Financial Data Visualization Image
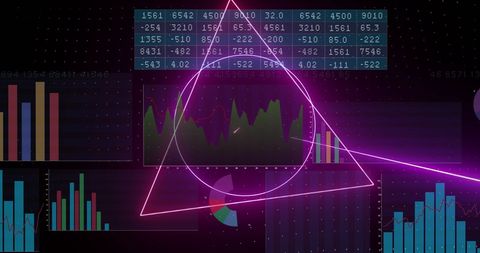
Futuristic photo featuring glowing geometric elements like circles and triangles combined with financial data charts, including bar graphs and line graphs. The background of dark space with bright neon highlights creates a feel of advanced technology and analytic sophistication. Suitable for illustrating financial articles, economic analysis, investment strategy presentations, and digital currency platforms, conveying a modern interpretation of financial markets and dynamic data plotting systems.
Powered by 


2
downloads
downloads
Tags:
More
Credit Photo
If you would like to credit the Photo, here are some ways you can do so
Text Link
photo Link
<span class="text-link">
<span>
<a target="_blank" href=https://pikwizard.com/photo/glowing-geometric-shapes-with-financial-data-visualization/a641d3724c14f297b916abdc158a4930/>PikWizard</a>
</span>
</span>
<span class="image-link">
<span
style="margin: 0 0 20px 0; display: inline-block; vertical-align: middle; width: 100%;"
>
<a
target="_blank"
href="https://pikwizard.com/photo/glowing-geometric-shapes-with-financial-data-visualization/a641d3724c14f297b916abdc158a4930/"
style="text-decoration: none; font-size: 10px; margin: 0;"
>
<img src="https://pikwizard.com/pw/medium/a641d3724c14f297b916abdc158a4930.jpg" style="margin: 0; width: 100%;" alt="" />
<p style="font-size: 12px; margin: 0;">PikWizard</p>
</a>
</span>
</span>
Free (free of charge)
Free for personal and commercial use.
Author: Awesome Content
Similar Free Stock Images

Premium


Premium


Premium


Premium


Premium


Premium


Premium


Premium


Premium


Premium


Premium


Premium


Premium


Premium


Premium


Premium


Premium


Premium


Premium


Premium


Premium


Premium


Premium


Premium