- Home >
- Stock Photos >
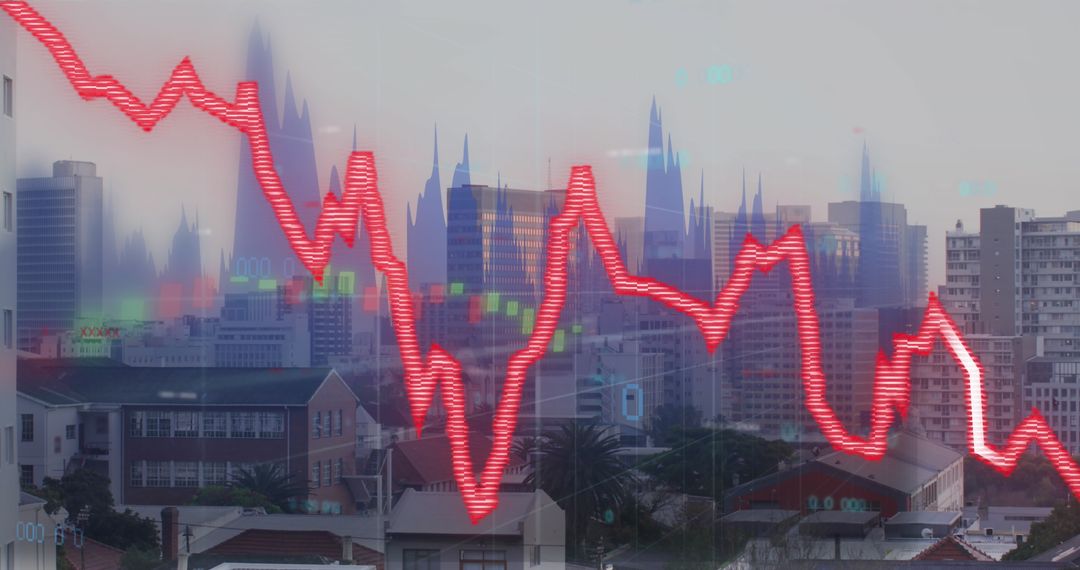
- Glowing Graph and Digital Connections on Global Map
Glowing Graph and Digital Connections on Global Map Image

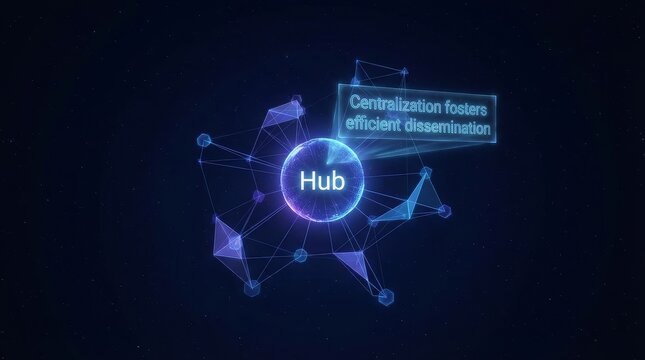
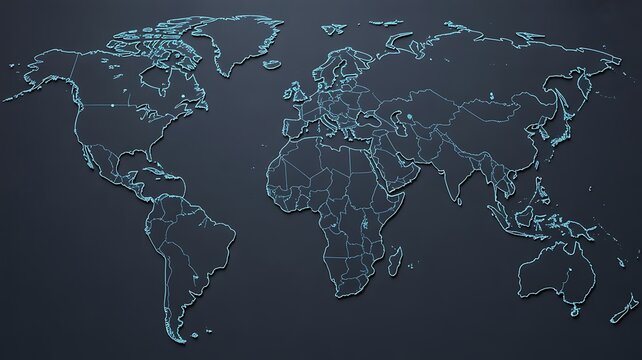
This image of a glowing neon graph overlaid on a global map represents digital connections and technology concepts. It is suitable for illustrating topics such as global trade, data analysis, network and communications technology, or innovative digital transformation platforms. Useful for websites, technology articles, business presentations in a digital economy context.
Powered by 


2
downloads
downloads
Tags:
More
Credit Photo
If you would like to credit the Photo, here are some ways you can do so
Text Link
photo Link
<span class="text-link">
<span>
<a target="_blank" href=https://pikwizard.com/photo/glowing-graph-and-digital-connections-on-global-map/091a362fd82711fb11f6f9306a8d4475/>PikWizard</a>
</span>
</span>
<span class="image-link">
<span
style="margin: 0 0 20px 0; display: inline-block; vertical-align: middle; width: 100%;"
>
<a
target="_blank"
href="https://pikwizard.com/photo/glowing-graph-and-digital-connections-on-global-map/091a362fd82711fb11f6f9306a8d4475/"
style="text-decoration: none; font-size: 10px; margin: 0;"
>
<img src="https://pikwizard.com/pw/medium/091a362fd82711fb11f6f9306a8d4475.jpg" style="margin: 0; width: 100%;" alt="" />
<p style="font-size: 12px; margin: 0;">PikWizard</p>
</a>
</span>
</span>
Free (free of charge)
Free for personal and commercial use.
Author: People Creations
Similar Free Stock Images

Premium


Premium


Premium


Premium


Premium


Premium


Premium


Premium


Premium


Premium


Premium


Premium


Premium


Premium


Premium


Premium


Premium


Premium


Premium


Premium


Premium


Premium


Premium


Premium