- Home >
- Stock Photos >
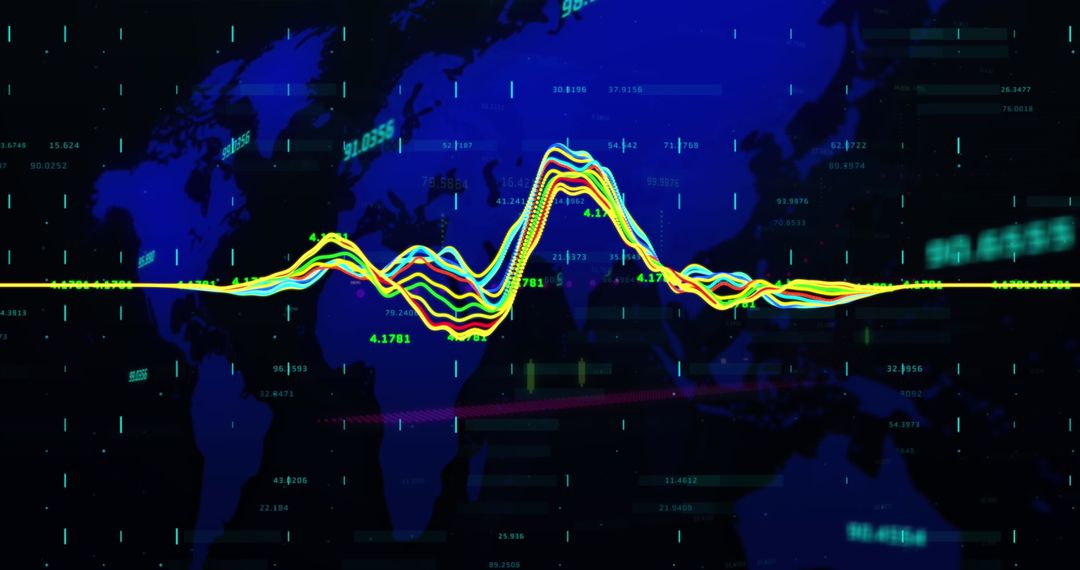
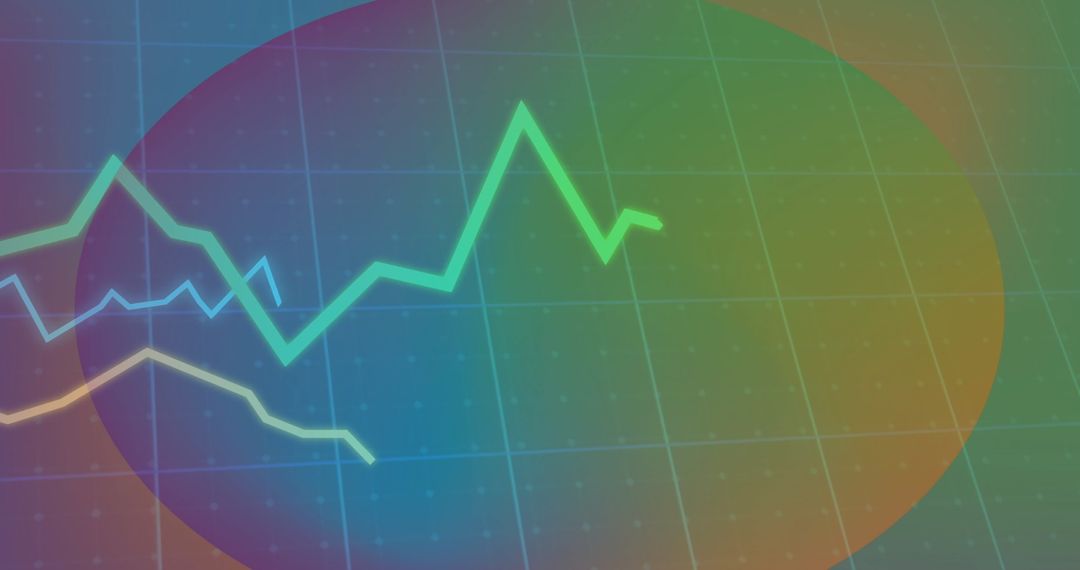
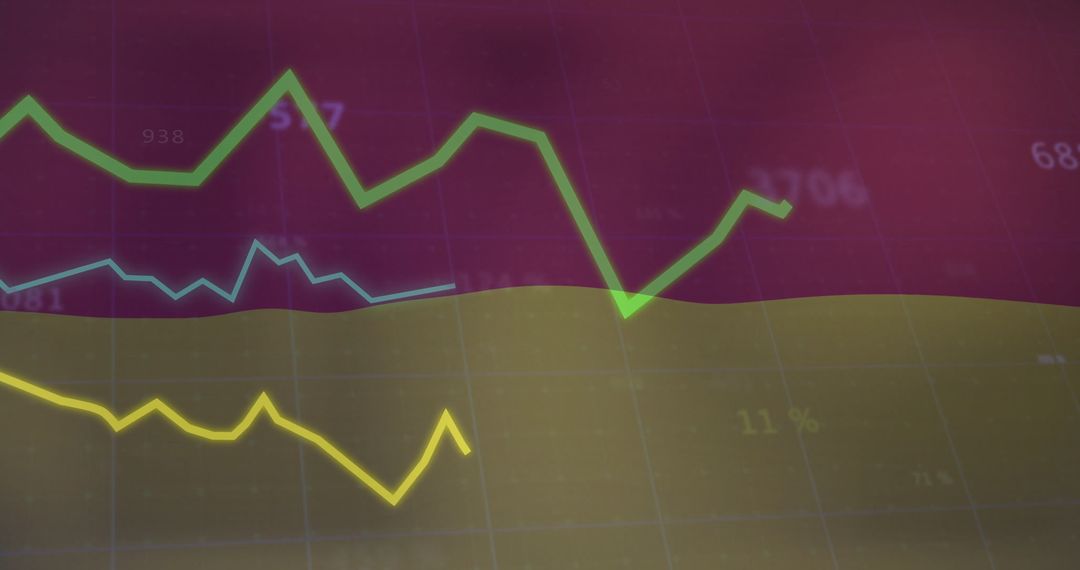
- Glowing neon line graph streaming across futuristic data visualization dashboard
Glowing neon line graph streaming across futuristic data visualization dashboard Image

Showcasing glowing neon green zigzag line dominating dashboard with secondary cyan and yellow lines over purple-pink gradient and grid, creating strong sense of motion and data flow. Background featuring vertical light streaks and soft glow, enhancing futuristic and tech-driven mood. Ideal for presenting financial performance and market trends, illustrating analytics dashboards and real-time monitoring, enhancing tech blog headers, investor pitch decks, and fintech marketing materials. Providing high-contrast composition, allowing overlay text, logos, and data labels without losing visual impact. Serving in website hero banners, social media posts, slide decks, reports, and event visuals for conferences and product launches.
Powered by  - Get 15% off with code: PIKWIZARD15


0
downloads
downloads
Tags:
More
Credit Photo
If you would like to credit the Photo, here are some ways you can do so
Text Link
photo Link
<span class="text-link">
<span>
<a target="_blank" href=https://pikwizard.com/photo/glowing-neon-line-graph-streaming-across-futuristic-data-visualization-dashboard/2f22d619220084ceeee2fc0a037469fd/>PikWizard</a>
</span>
</span>
<span class="image-link">
<span
style="margin: 0 0 20px 0; display: inline-block; vertical-align: middle; width: 100%;"
>
<a
target="_blank"
href="https://pikwizard.com/photo/glowing-neon-line-graph-streaming-across-futuristic-data-visualization-dashboard/2f22d619220084ceeee2fc0a037469fd/"
style="text-decoration: none; font-size: 10px; margin: 0;"
>
<img src="https://pikwizard.com/pw/medium/2f22d619220084ceeee2fc0a037469fd.jpg" style="margin: 0; width: 100%;" alt="" />
<p style="font-size: 12px; margin: 0;">PikWizard</p>
</a>
</span>
</span>
Free (free of charge)
Free for personal and commercial use.
Author: Creative Art
Similar Free Stock Images

Premium


Premium


Premium


Premium


Premium


Premium


Premium


Premium


Premium


Premium


Premium


Premium


Premium


Premium


Premium


Premium


Premium


Premium


Premium


Premium


Premium


Premium


Premium


Premium