- Home >
- Stock Photos >
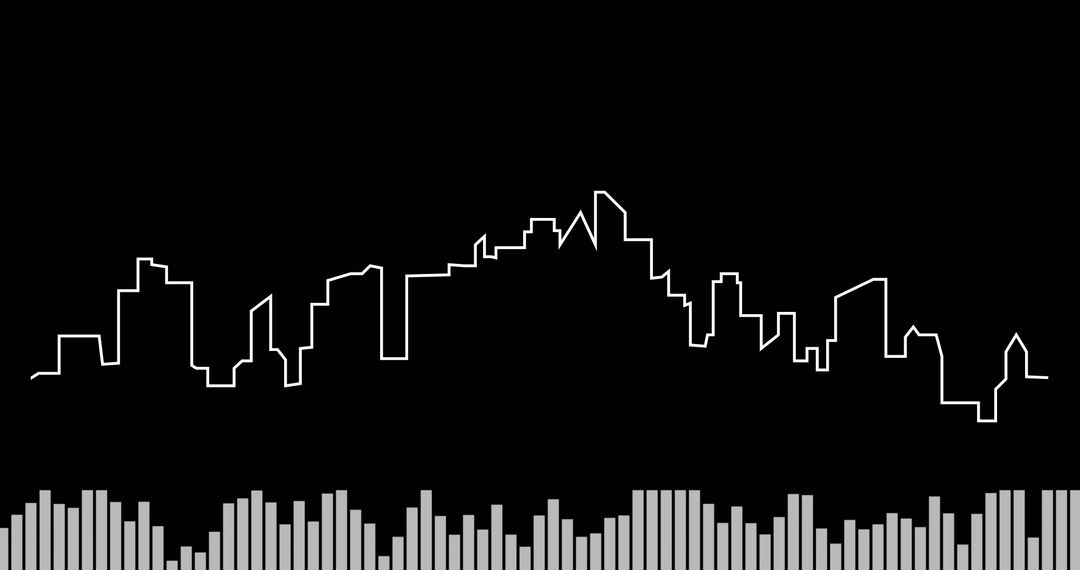
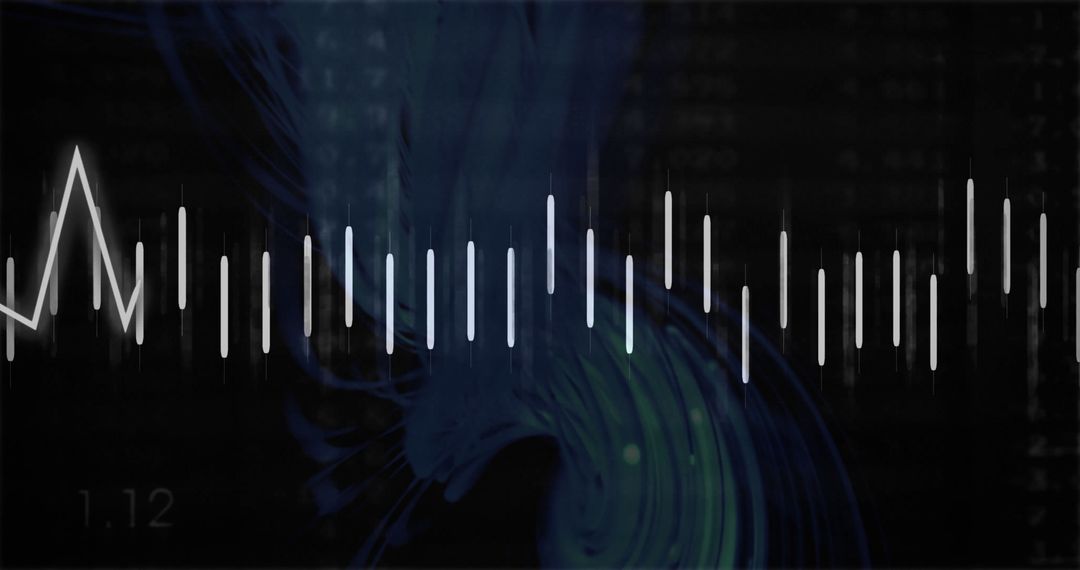
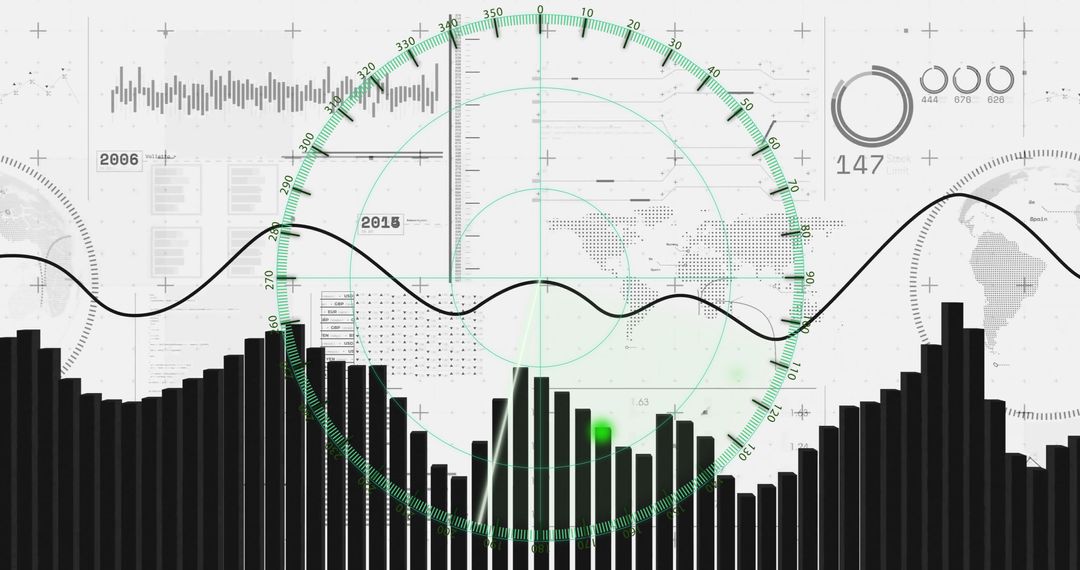
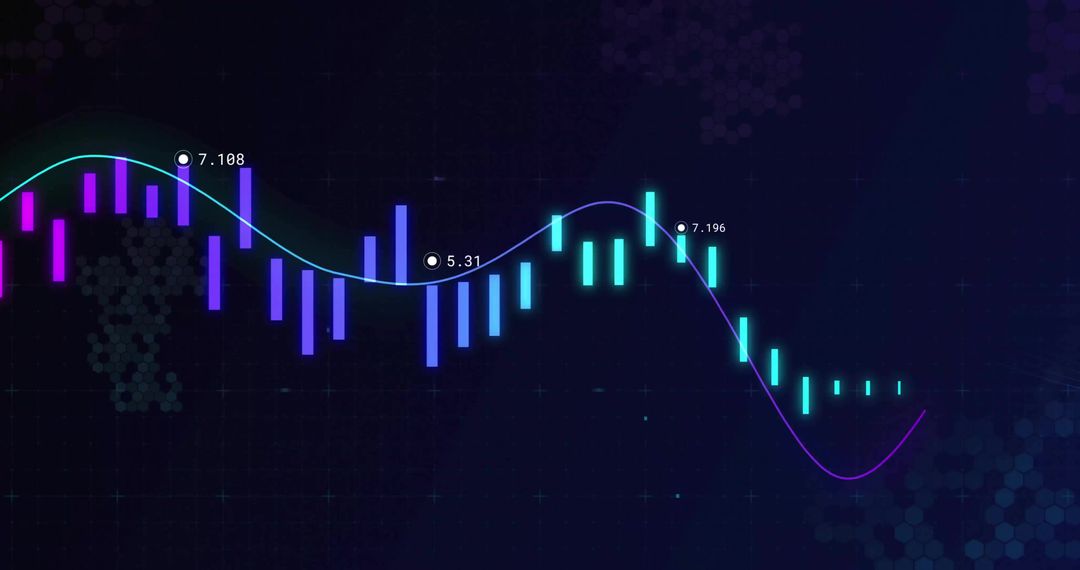
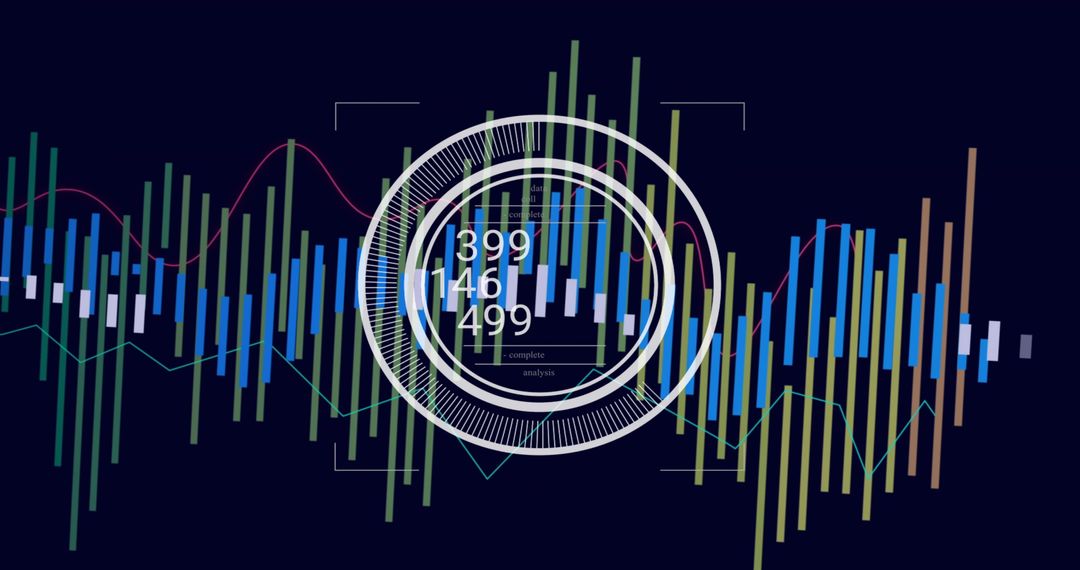
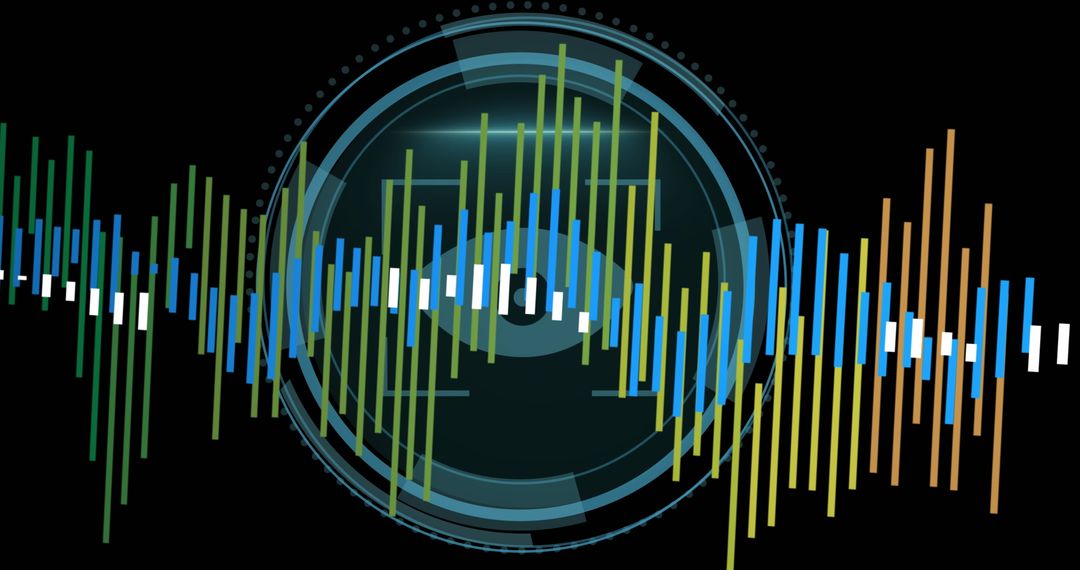
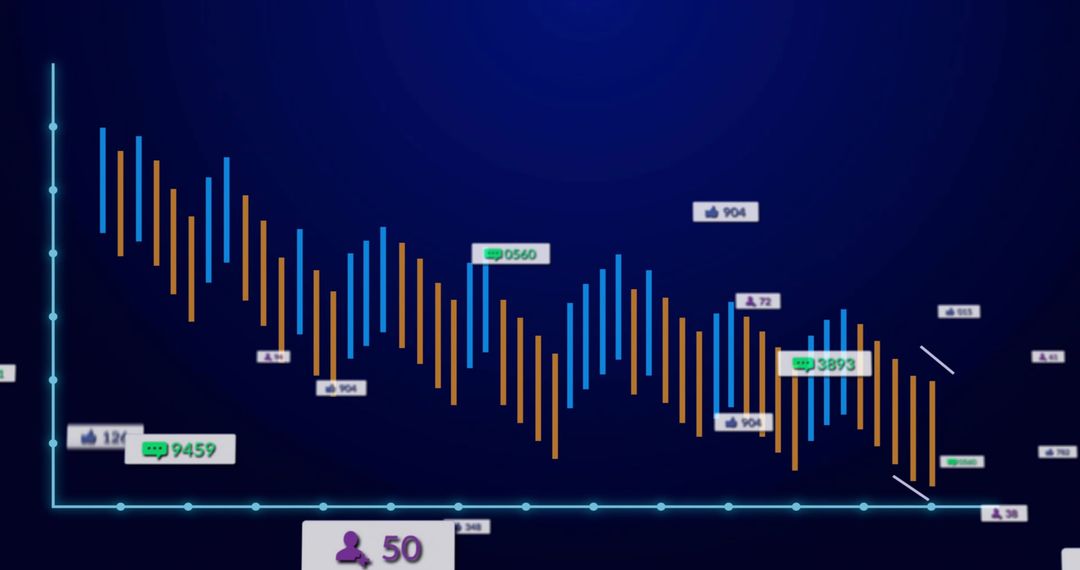
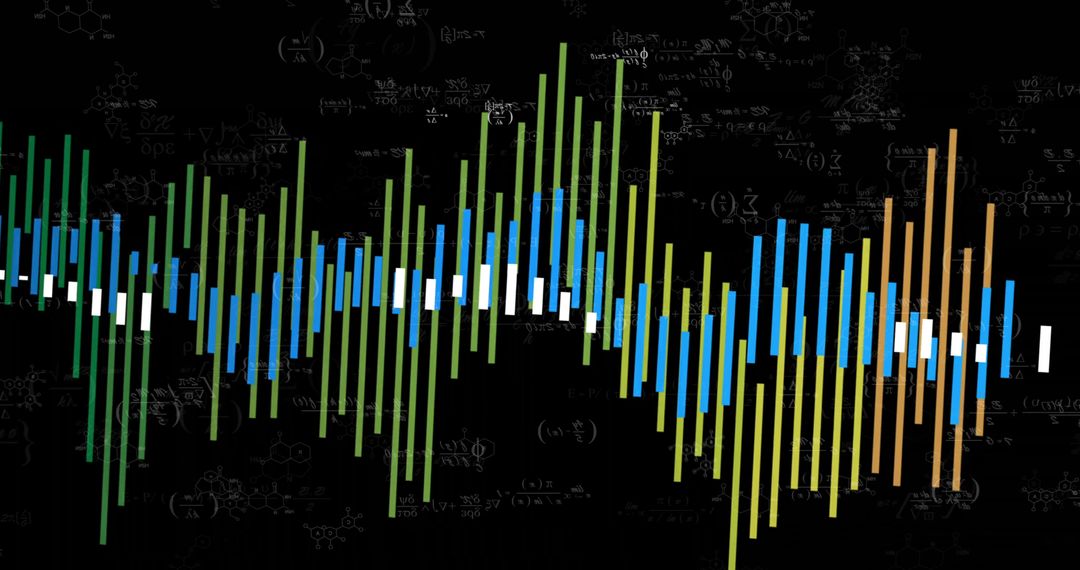
- Glowing Neon Power Icon Over Data Dashboard Showing Audio Equalizer and Line Chart
Glowing Neon Power Icon Over Data Dashboard Showing Audio Equalizer and Line Chart Image
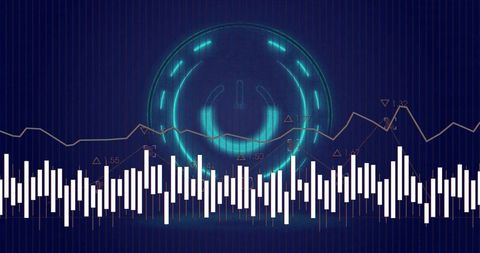
Showing glowing cyan power icon centered on dark data dashboard, featuring vertical equalizer bars and overlaid line chart with gridlines and subtle reflections. Combining audio waveform elements with financial trend visuals, creating hybrid tech and music aesthetic. Suiting website hero, app background, podcast cover, music production branding, fintech presentation, cybersecurity report, marketing banner, and social media post. Working well for editorial about AI energy management, IoT monitoring, data analytics, and digital transformation. Leaving ample negative space for text, logo, or UI mockup, scaling for web headers, presentation slides, posters, and print collateral.
Powered by  - Get 15% off with code: PIKWIZARD15


0
downloads
downloads
Tags:
More
Credit Photo
If you would like to credit the Photo, here are some ways you can do so
Text Link
photo Link
<span class="text-link">
<span>
<a target="_blank" href=https://pikwizard.com/photo/glowing-neon-power-icon-over-data-dashboard-showing-audio-equalizer-and-line-chart/f899fc2f7e81fc8ceb26a115a26f3553/>PikWizard</a>
</span>
</span>
<span class="image-link">
<span
style="margin: 0 0 20px 0; display: inline-block; vertical-align: middle; width: 100%;"
>
<a
target="_blank"
href="https://pikwizard.com/photo/glowing-neon-power-icon-over-data-dashboard-showing-audio-equalizer-and-line-chart/f899fc2f7e81fc8ceb26a115a26f3553/"
style="text-decoration: none; font-size: 10px; margin: 0;"
>
<img src="https://pikwizard.com/pw/medium/f899fc2f7e81fc8ceb26a115a26f3553.jpg" style="margin: 0; width: 100%;" alt="" />
<p style="font-size: 12px; margin: 0;">PikWizard</p>
</a>
</span>
</span>
Free (free of charge)
Free for personal and commercial use.
Author: Authentic Images
Similar Free Stock Images

Premium


Premium