- Home >
- Stock Photos >
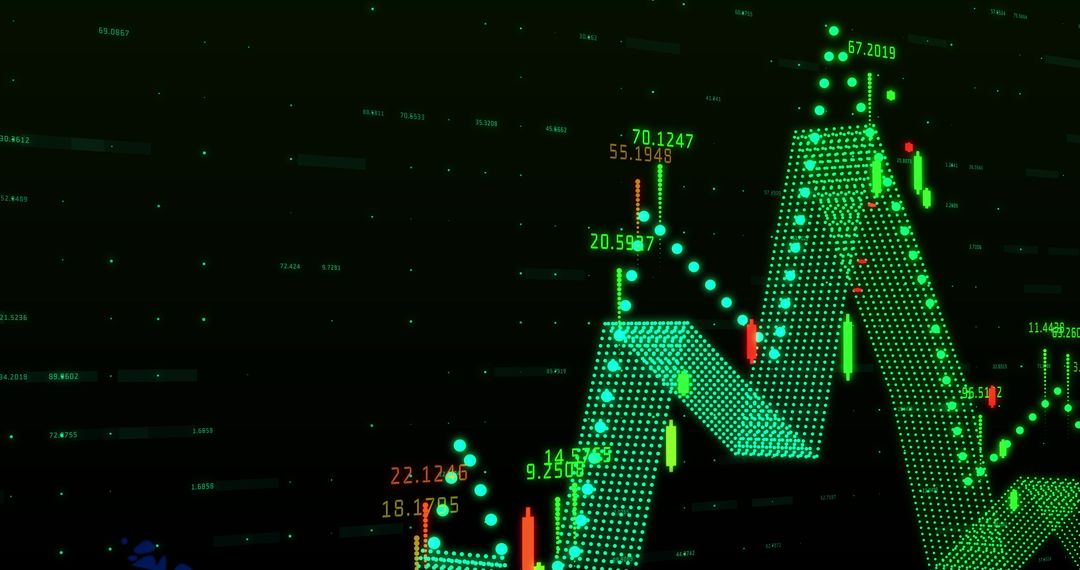
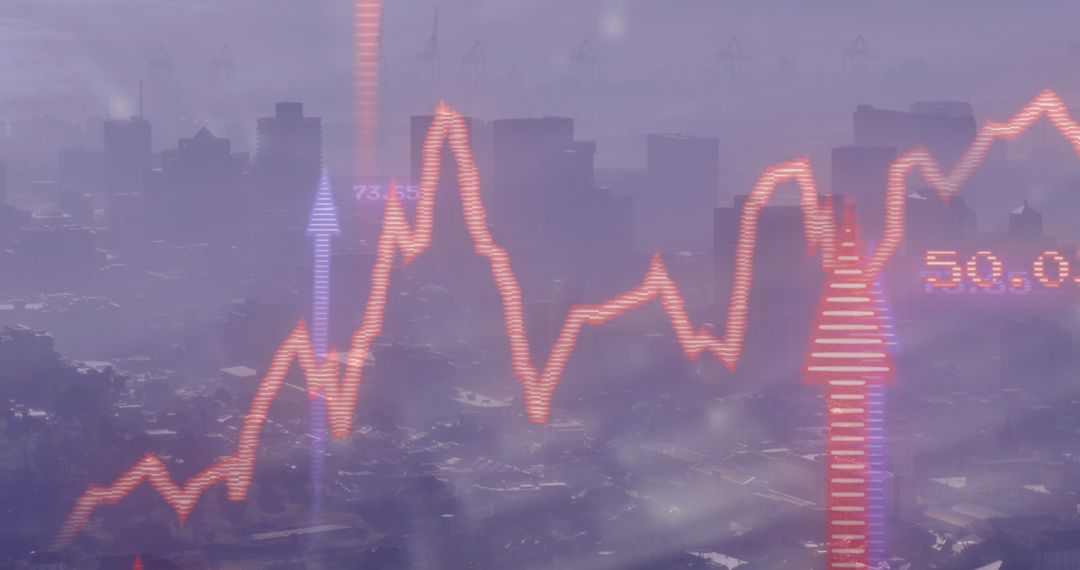
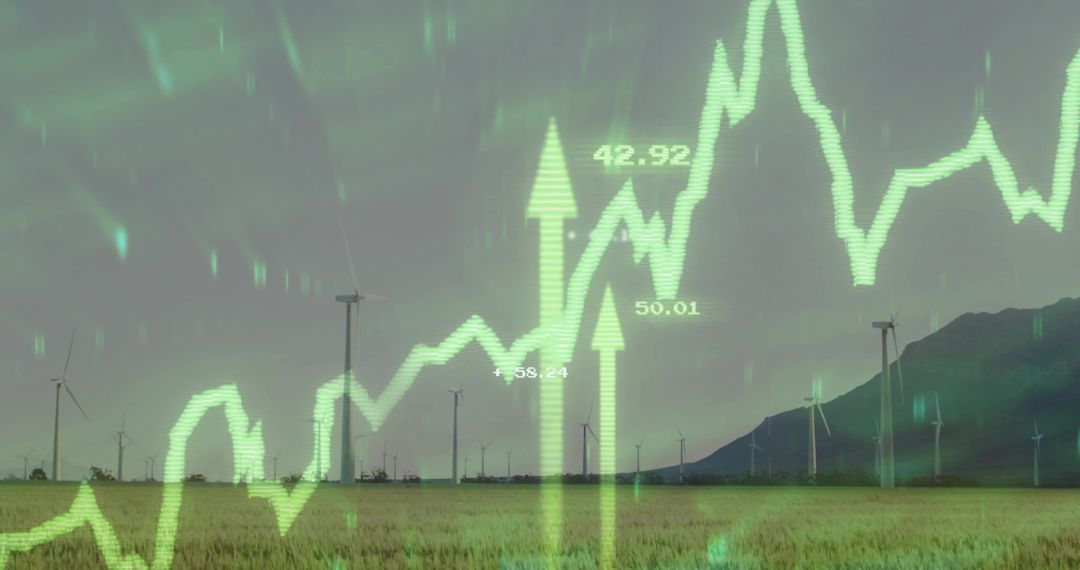
- Glowing neon stock market chart showing bullish uptrend with red arrow and data ticker
Glowing neon stock market chart showing bullish uptrend with red arrow and data ticker Image

Abstract neon green stock chart showing jagged yellow line rising across layered bar grid, overlaid with red arrow and scrolling ticker. Composition highlighting bullish market movement, volatility spikes, and upward momentum. Suitable for financial articles, investment reports, trading platforms, business presentations, market analysis blogs, social media posts announcing gains, newsletter headers. Working well as hero banner, background for data stories, slide deck opener, infographic element, or website header. Color palette featuring neon green and yellow providing high contrast for overlaying text and icons. File working well with cropping to banner and square formats.
Powered by  - Get 15% off with code: PIKWIZARD15


0
downloads
downloads
Tags:
More
Credit Photo
If you would like to credit the Photo, here are some ways you can do so
Text Link
photo Link
<span class="text-link">
<span>
<a target="_blank" href=https://pikwizard.com/photo/glowing-neon-stock-market-chart-showing-bullish-uptrend-with-red-arrow-and-data-ticker/31b338511efe4793359e2056c4d3b4c0/>PikWizard</a>
</span>
</span>
<span class="image-link">
<span
style="margin: 0 0 20px 0; display: inline-block; vertical-align: middle; width: 100%;"
>
<a
target="_blank"
href="https://pikwizard.com/photo/glowing-neon-stock-market-chart-showing-bullish-uptrend-with-red-arrow-and-data-ticker/31b338511efe4793359e2056c4d3b4c0/"
style="text-decoration: none; font-size: 10px; margin: 0;"
>
<img src="https://pikwizard.com/pw/medium/31b338511efe4793359e2056c4d3b4c0.jpg" style="margin: 0; width: 100%;" alt="" />
<p style="font-size: 12px; margin: 0;">PikWizard</p>
</a>
</span>
</span>
Free (free of charge)
Free for personal and commercial use.
Author: Awesome Content
Similar Free Stock Images
Premium


Premium


Premium


Premium


Premium


Premium


Premium


Premium


Premium


Premium


Premium


Premium


Premium


Premium


Premium


Premium


Premium


Premium


Premium


Premium


Premium


Premium


Premium


Premium