- Home >
- Stock Photos >
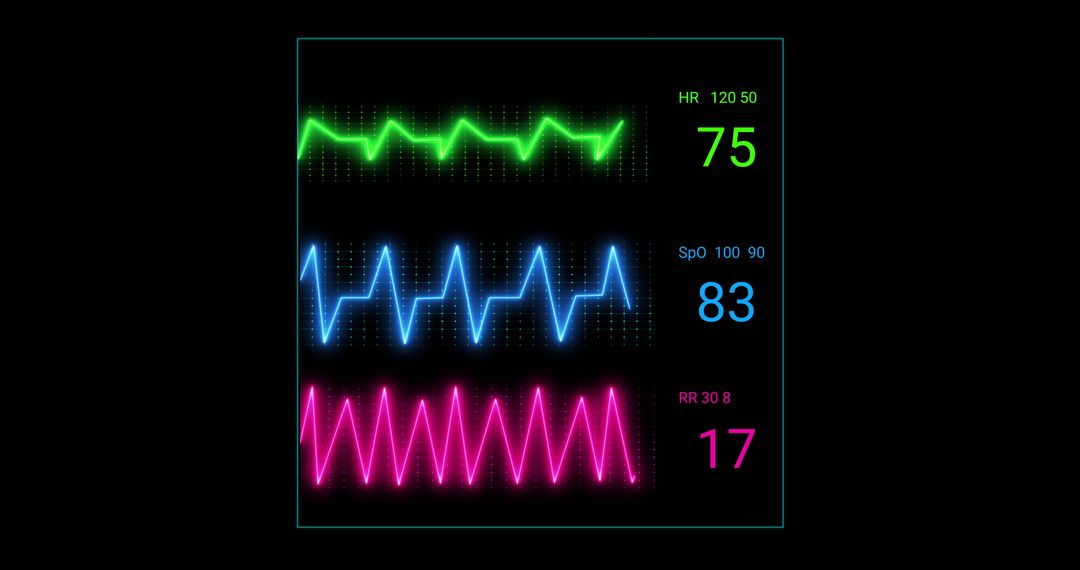
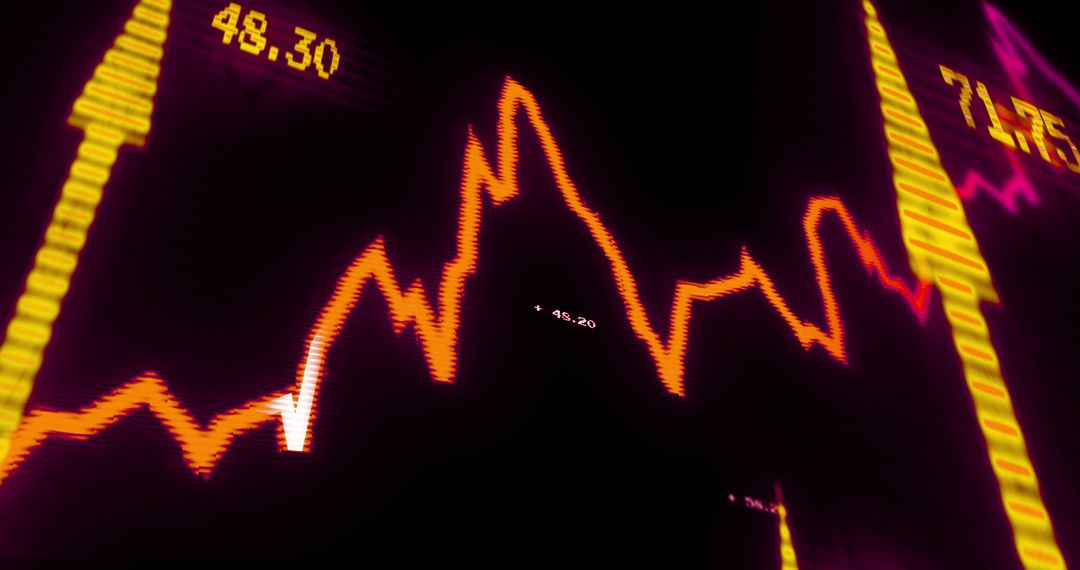
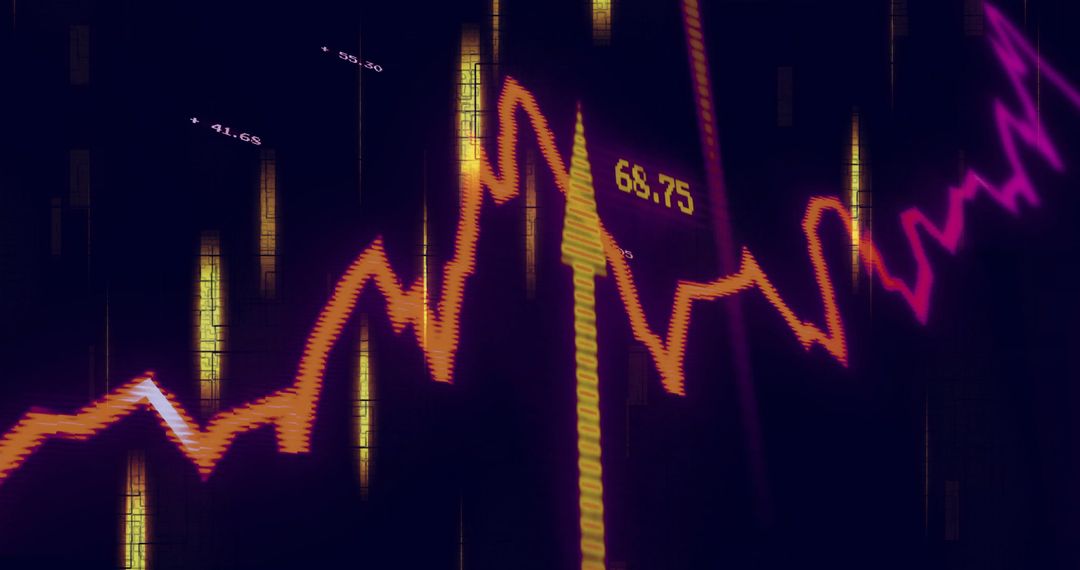
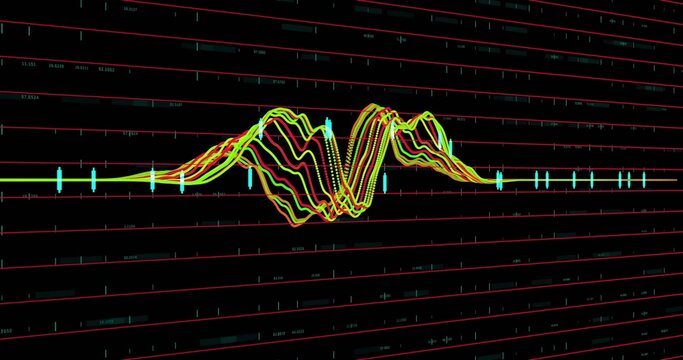
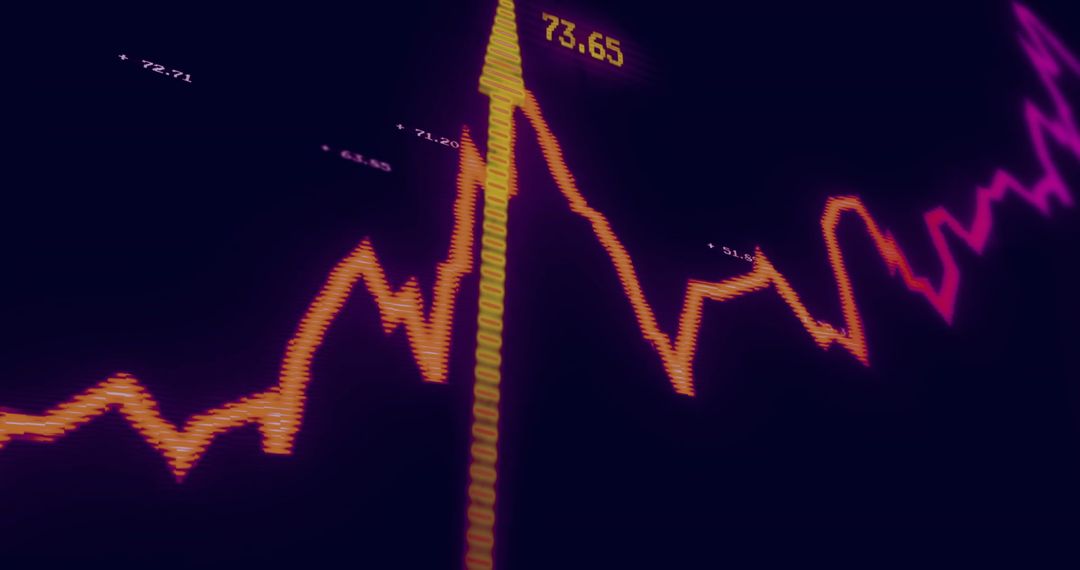
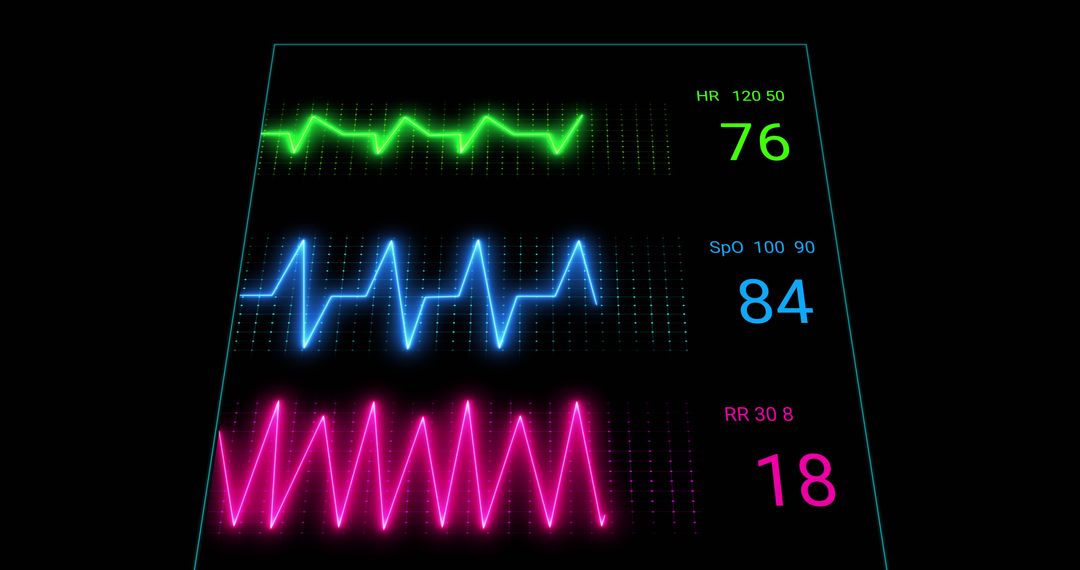
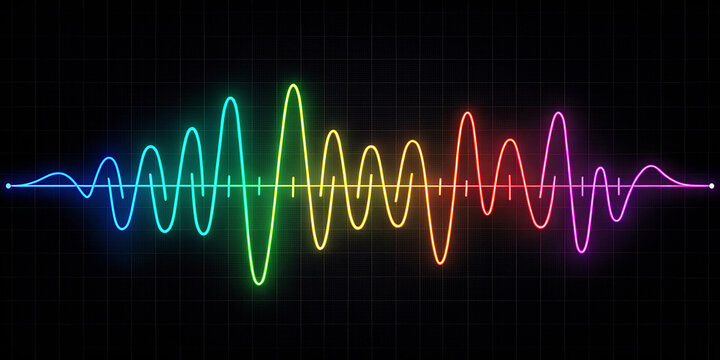
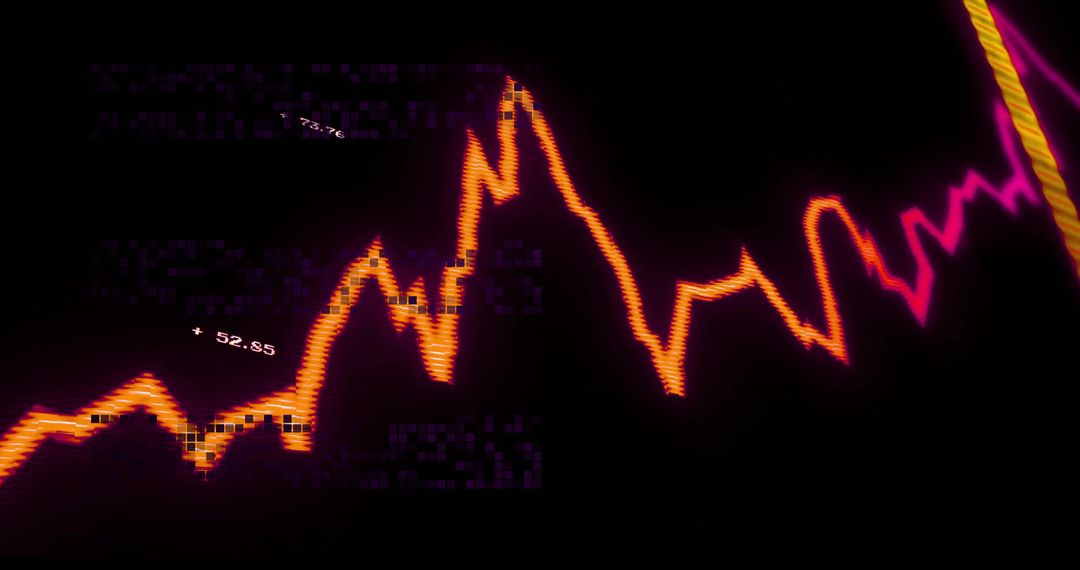
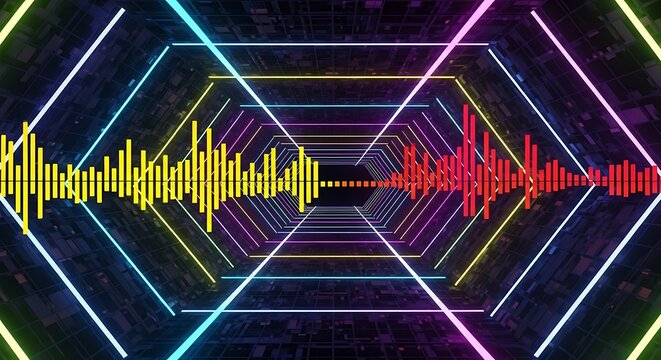
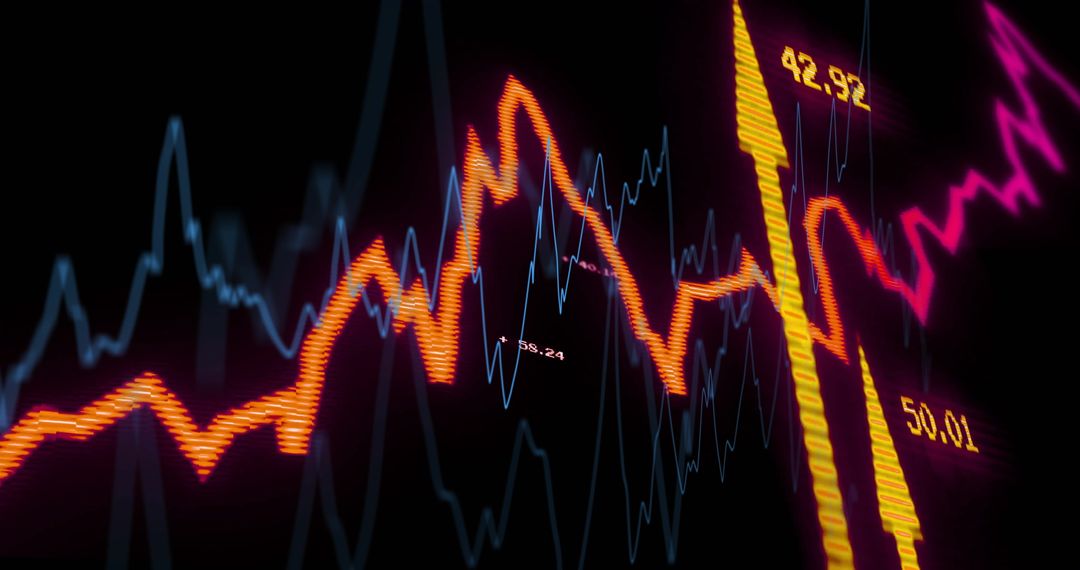
- Glowing neon waveform crossing dark monitor with scanning yellow band and numeric label
Glowing neon waveform crossing dark monitor with scanning yellow band and numeric label Image
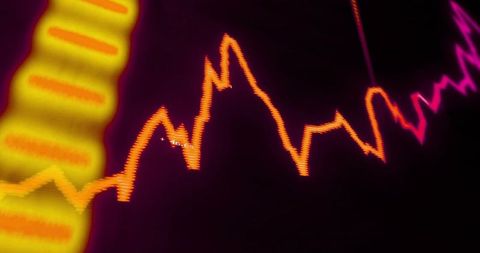
Showing neon orange waveform zigzagging across deep purple monitor with glowing yellow band and magenta scanlines, small numeric label near peak. Featuring high-contrast color palette and pixelated scanline texture, creating retro-futuristic mood. Serving tech and music projects, including website headers, app backgrounds, electronic music album art, podcast covers, presentation slides about data, signal processing, or market volatility. Fitting as hero banner, social media post, print poster, or editorial illustration for articles on analytics, cybersecurity, or digital art. Supporting overlays, text treatments, and animated parallax effects to enhance motion and depth.
Powered by 


0
downloads
downloads
Tags:
More
Credit Photo
If you would like to credit the Photo, here are some ways you can do so
Text Link
photo Link
<span class="text-link">
<span>
<a target="_blank" href=https://pikwizard.com/photo/glowing-neon-waveform-crossing-dark-monitor-with-scanning-yellow-band-and-numeric-label/0f204402dd78501077ff5f605a4fc1d0/>PikWizard</a>
</span>
</span>
<span class="image-link">
<span
style="margin: 0 0 20px 0; display: inline-block; vertical-align: middle; width: 100%;"
>
<a
target="_blank"
href="https://pikwizard.com/photo/glowing-neon-waveform-crossing-dark-monitor-with-scanning-yellow-band-and-numeric-label/0f204402dd78501077ff5f605a4fc1d0/"
style="text-decoration: none; font-size: 10px; margin: 0;"
>
<img src="https://pikwizard.com/pw/medium/0f204402dd78501077ff5f605a4fc1d0.jpg" style="margin: 0; width: 100%;" alt="" />
<p style="font-size: 12px; margin: 0;">PikWizard</p>
</a>
</span>
</span>
Free (free of charge)
Free for personal and commercial use.
Author: Awesome Content
Similar Free Stock Images

Premium

Premium


Premium

Premium


Premium


Premium


Premium


Premium


Premium


Premium


Premium

Premium


Premium


Premium


Premium


Premium


Premium


Premium


Premium


Premium


Premium


Premium


Premium


Premium