1. Home > 
  2. Stock Photos > 
  3. Glowing teal axis displaying sustainability dashboard with CO2, electric car, energy icons

Glowing teal axis displaying sustainability dashboard with CO2, electric car, energy icons Image

Glowing teal axis displaying sustainability dashboard with CO2, electric car, energy icons

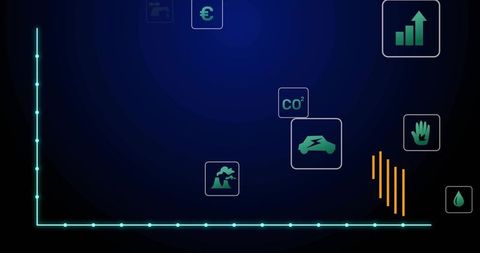
Depicting glowing teal L-shaped axis with illuminated nodes along bottom on dark blue gradient backdrop. Featuring floating icon tiles for CO2, electric vehicle, factory emissions, euro currency, hand with leaf, water drop, growth chart and vertical bars. Emphasizing sustainability dashboard concept, emissions tracking, energy transition and industrial data. Using neon teal and green palette with minimalist futuristic UI style and vector-ready elements for scaling and customization. Helping illustrate data for sustainability reports, corporate presentations, dashboard mockups, investor pitch decks, website hero banners, social media posts and environmental blogs. Offering space for overlaying charts, annotations and branding while maintaining clean modern look.

Powered by Shutterstock logo - Get 15% off with code: PIKWIZARD15
Businessperson analyzing net zero carbon dashboard hologram, showing CO2 emission data and sustainable energy icons, highlighting carbon reduction and environmental responsibility concept. - Powered by Shutterstock - Get 15% off with code: PIKWIZARD15Close-up of hand using pen to interact with CO2 emissions dashboard hologram, displaying eco data, cloud icon, and environmental analytics, symbolizing carbon tracking and green technology. - Powered by Shutterstock - Get 15% off with code: PIKWIZARD15Hand analyzing environmental data with net zero dashboard, carbon footprint metrics, and green analytics. Concept of ESG, sustainability, eco technology, and digital climate solutions. - Powered by Shutterstock - Get 15% off with code: PIKWIZARD15Person interacting with digital ESG interface showing sustainability data and AI technology, in modern graphic style on dark background, concept of innovation - Powered by Shutterstock - Get 15% off with code: PIKWIZARD15Person interacting with ESG sustainability AI dashboard hologram, featuring CO2 alerts, eco icons, net zero targets, and green analytics, symbolizing eco-conscious artificial intelligence use. - Powered by Shutterstock - Get 15% off with code: PIKWIZARD15

Credit Photo

If you would like to credit the Photo, here are some ways you can do so

Free (free of charge)

Free for personal and commercial use.

Author: People Creations

Similar Free Stock Images

Colorful Digital Stock Market Graph on Grid Background
Premium
Businessman analyzing ESG data on digital interface with bar chart, environmental icons and corporate responsibility dashboard, promoting sustainable development, green investment, ethical governance
Digital Interface with Data Analytics Visuals
Abstract Graph with Digital Blue and Orange Lines
Dynamic Financial Graph Visualizing Market Trends
Abstract Financial Graph Illustration on Dark Background
Premium
Digital ESG dashboard on tablet showing environment, social, and governance metrics with green technology icons.
Economic Trends Analysis with Financial Indicators and Graphs
Dynamic Financial Data Analysis with Illuminated Graphs
Digital Cloud Computing with Percentage Graph Indicators
Dynamic Financial Charts and Graphs Indicating Market Trends
Premium
Virtual dashboard displaying energy metrics on green backdrop, with energy and sustainability icons. Eco-friendly, sustainability, analytics, data visualization, technology, renewable, environmental
Futuristic Digital Network with Data Streams and Connections
Digital Financial Data Processing with Graphs and Charts
Colorful Bar Graph with Data Overlay on Black Background
Colorful Financial Data Analytics and Global Market Trends
Premium
Electrical grid data on isolated screen PC in empty office used to identify energy audit findings. Transmission tower efficiency metrics analytics dashboard on chroma key computer monitor
Financial Data Analysis on Blue Digital Interface
Interactive Social Media Metrics Overlaid on Business Data Graph
Futuristic Digital Interface with Data Graphs
Abstract Data Visualization Digital Chart Background
Premium
Data-Driven Sustainability: Visualizing ESG Metrics on a Laptop and Tablet for Informed Decisions
Dynamic 3D Renewable Energy and Finance Data Analysis
Digital Data Visualization with Icons and Graphs on Grid Background
Dynamic Data Visualization Chart with Neon Grid and Peaks
Digital Data Visualization on Futuristic Dashboard
Premium
Engineer reviews electrical grid data on green screen PC to identify energy audit findings. Worker looks at transmission tower efficiency metrics analytics dashboard on mockup computer
Neon green waveform streaming across digital network with keyboard and analytics panels
Neon Green Data Waveform Visualizing Real-Time Analytics with Interactive UI Badges
Futuristic 3D analytics dashboard displaying rising green line chart with social callouts
Orange Step Chart Crossing Dark Blue Grid with Neon Axes and Data Callouts
Premium
Sustainable Strategy: Professional woman Interacting with ESG Data Dashboard and charts on Tablet
Futuristic Stock Market Graph with Digital Data
Digital Finance Analytics with Stock Market Data
Premium
Hands interacting with transparent digital interface displaying ESG, AI, and eco-related data graphics over a city and forest background, symbolizing green tech concept
3D Financial Market Analysis with Declining Stock Graph
Colorful Bar Graph on Dark Background Illustrates Data Trends
Futuristic Financial Graph on Purple Retro Background
Digital Ecology Icons in Futuristic Data Display
Premium
Finger tapping digital screen with net zero checklist and sustainability goals, symbol of environmental responsibility.
Dynamic Stock Market Graph Displaying Surging Growth
Dynamic Data Graphs on Digital Interface Background
Green Digital Flow with Technology Icons and Code Overlay
Global Finance and COVID-19 Impact Representation
Premium
Digital dashboard showing carbon reduction, CO2 metrics, and green energy technology promoting eco-friendly sustainability and environmental innovation.
Digital Stock Market Chart and Networking Interface
Dynamic Financial Data Visualization on Digital Grid Background
Futuristic Keyboard Analytics Display with Digital Graphs and Numbers
Rising Arrows on Vibrant Green Energy Background
Premium
Businessman using tablet with CO2 emission analytics dashboard, concept of carbon footprint tracking, sustainability reporting, environmental performance, and corporate climate management.
Smart Energy Solutions and Digital Technology Finance
Dynamic Data Graphs Display on Dark Digital Background
Dynamic Financial Data Analysis with Growth Indicators
Dynamic Analytics Dashboard with Engagement Alerts
Premium
Close up of engineer reviewing electrical grid data on tablet to identify energy audit findings and upgrade needs. Worker reads transmission tower efficiency metrics analytics dashboard on device
Green Graph with Thumbs-Up Notifications Symbolizing Positive Data Trends
Digital Analytics Dashboard with Interactive Data Visualization
Candlestick Chart Visualization with Indicators and Growth Highlight
Neon Fingerprint Lock Overlaying Red and Green Candlesticks on Digital Grid
Premium
A close-up of a hand interacting with a holographic digital interface showcasing renewable energy metrics, emphasizing innovation in technology and sustainable management solutions.
Cyan Data Stream Visualizing Social Engagement Metrics on Dark Analytics Dashboard
Purple analytics dashboard with white line graph, tan bars and blue notification badges
Displaying Social Media Engagement Dashboard with Colorful Time-Series Bars and Tooltips
Digital Financial Market Data Visualization
Vibrant Financial Data Analysis on Black Background
Abstract Financial Market Data Analysis Visualization
Premium
Optimizing ESG Performance: Professional Analyzing AI-Generated Sustainability Dashboard on Laptop
Abstract Financial Graph with Bar and Line Charts on Dark Background
Ecology Icons Interface Inspiring Greener Communication Choices
Futuristic Global Business Data with Digital Interface
Abstract Financial Data Display with Upward Graph Curves
Premium
Optimizing ESG Performance: Professional Analyzing AI-Generated Sustainability Dashboard on Laptop
Stagflation Concept with Digital Graphs and Data Patterns
Digital Graphs Representing Data and Analytics on Black Background
Digital Interface with Data Graphs and Charts on Blue Background
High-Tech Financial Data Analysis Display with Graphs
Premium
Strategizing Sustainability: A Professional Analyzing ESG Metrics and Data-Driven Insights on a Laptop
Abstract Financial Data Visualization with Graphs
Digital Graph with Rising and Falling Lines on Grid Background
Abstract Data Visualization on Blue Background for Technology Concept
Global Business Finance Data Analysis Visualization
Premium
Displaying overlays floating over error code dashboard, with CO2 water factory scale plant icons. Digital, analytics, futuristic, sustainability, monitoring, industrial, environmental
Dynamic Financial Data Visualization with Binary Code Overlay
Colorful Financial Data Visualization with Digital Graph Elements
Futuristic Digital Analytics Chart with Code Overlay
Futuristic Technology Analytics Interface on Dark Background
Premium
Data-Driven Sustainability: Visualizing ESG Metrics on a Laptop and Tablet for Informed Decisions
Futuristic Multi-Series Data Visualization Dashboard Chart
Futuristic Data Visualization with Social Media Elements
Interactive Digital Infographic with Callouts and Graph Elements
Neon Green 3D Grid Showing Holo Energy Icons, Financial Nodes and Analytics Dashboard
Premium
Displaying neon green hex icons and red and blue graphs on data dashboard, with energy metrics. Technology, analytics, futuristic, sustainability, digital, innovation, data visualization
Displaying Falling Candlestick Chart on Dark Data Dashboard with Teal Axis and Metrics
Green Dotted Market Mesh Chart Displaying Candlestick Patterns and Volatility Dashboard
Dynamic Financial Data Visualization with Blue Trends
Abstract Digital Data Network with Graphs and Symbols
Futuristic Data Analysis with Chart and Digital Graphics
Dynamic Financial Fluctuation on Digital Graph
Premium
Engineer using laptop to monitor solar energy performance dashboard in solar power plant, renewable energy technology and data analytics for efficient clean energy management system
Ecology Icons on Digital Data Wave Interface
Futuristic Data Processing Animation with Media Icons
Digital Data Visualization with Blue Grid and Timeline
Data Security with Tech Bar Graph Overlay
Premium
Displaying dashboard in modern corridor showing bars, candlesticks, pink line, green hex icons. Visualization, analytics, data, finance, energy, sustainability, metrics
Holographic Financial Graph with Dynamic Line Chart
Digital Financial Data Visualization with Graphs and Charts
Abstract Digital Financial Data Chart with Pink Line Oscillations
Dynamic Data Flow Over Digital Graphical Interface
Premium
This image presents a futuristic electric vehicle dashboard interface highlighting essential battery management metrics, showcasing technology integration in urban mobility.
Data Visualization on Security Shield Interface for Cyber Security
Data Analysis Graphics on Digital Grid Background
Analyzing Financial Data on Digital World Map Background
Financial Icons with Green Data Processing on Black Grid Background
Premium
Professional woman discusses data on a sustainability KPI dashboard during a collaborative office meeting. Young business analyst evaluates environmental performance metrics on a screen.
Financial Data Analysis Overlaying Urban Cityscape Background
Digital Interface Displaying Financial Market Trends
Abstract Data Visualization with Circular Markers and Numeric Labels
Futuristic Data Analytics Visualization in Neon Design
Premium
A person interacts with a tablet displaying digital metrics related to sustainability and technology in a natural setting, blending nature with innovation.
3D Candlestick Chart with Social Media Reactions
Colorful Candlestick Chart on Trading Interface
Visualizing market volatility on navy gradient with magenta and blue trend lines, copy space
Neon Green Waveform Data Visualization Displaying Social Metric Bubbles on Dark Analytics Dashboard
Premium
Optimizing Sustainable Growth: Professional Analyzing ESG Performance Dashboard on Digital Devices
Neon Social Media Analytics Line Chart with Engagement Bubbles Showing Likes Comments