- Home >
- Stock Photos >
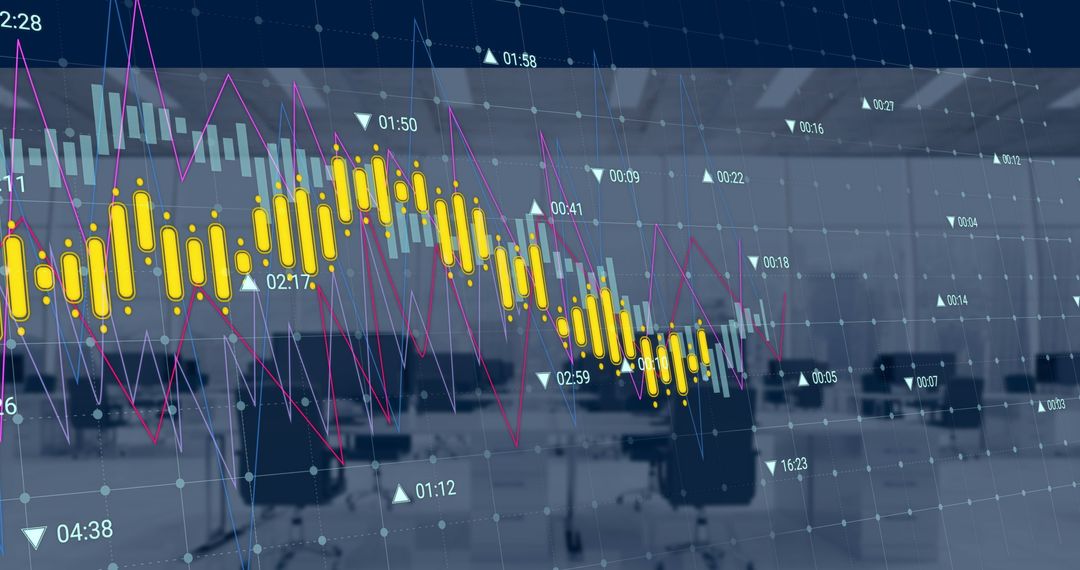
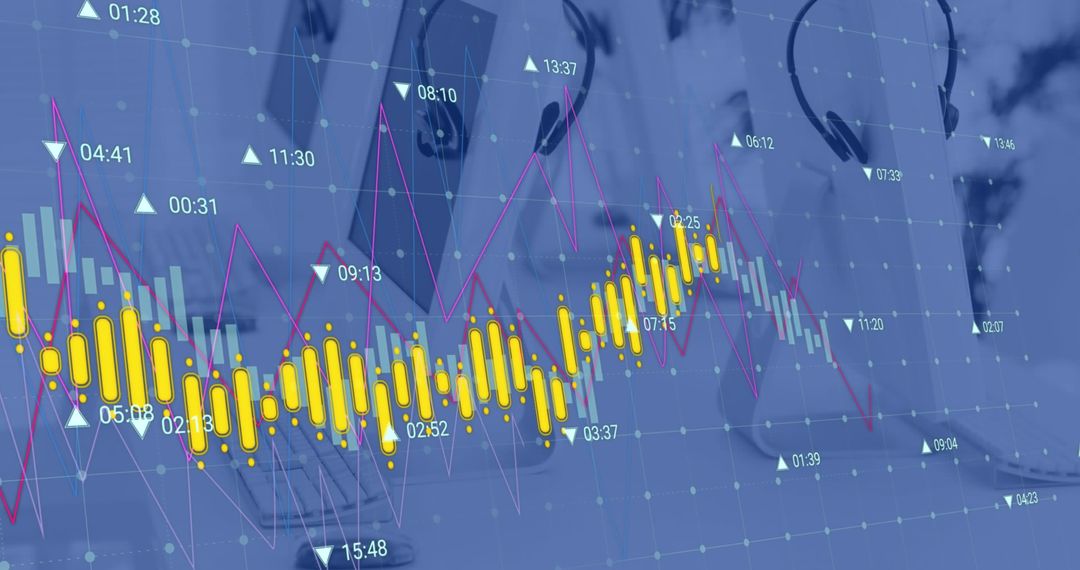
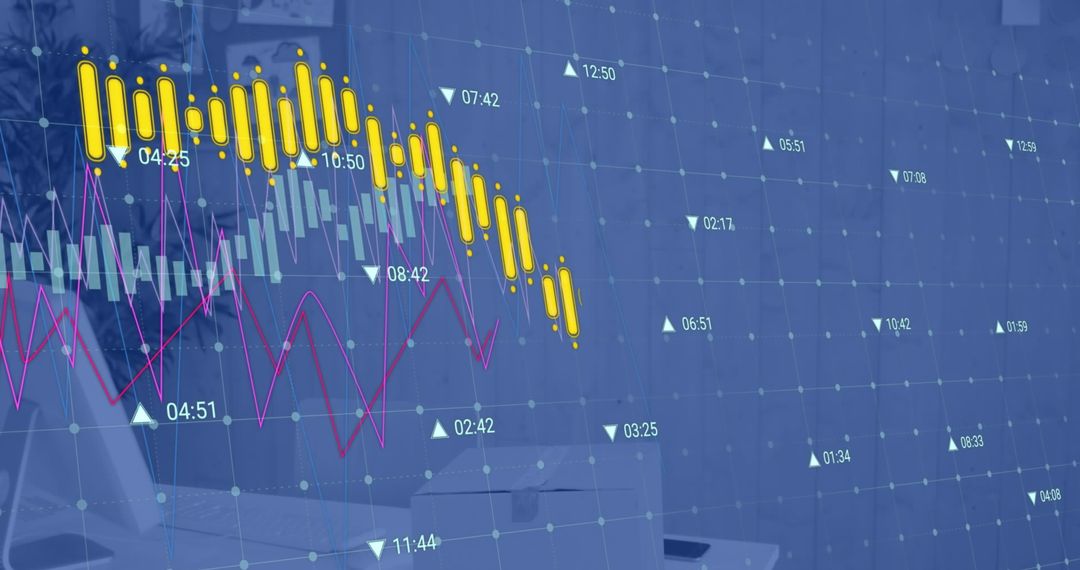
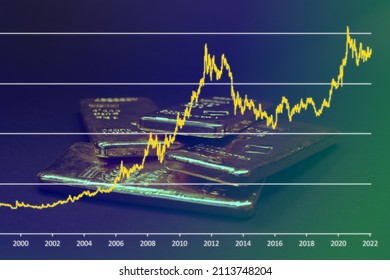
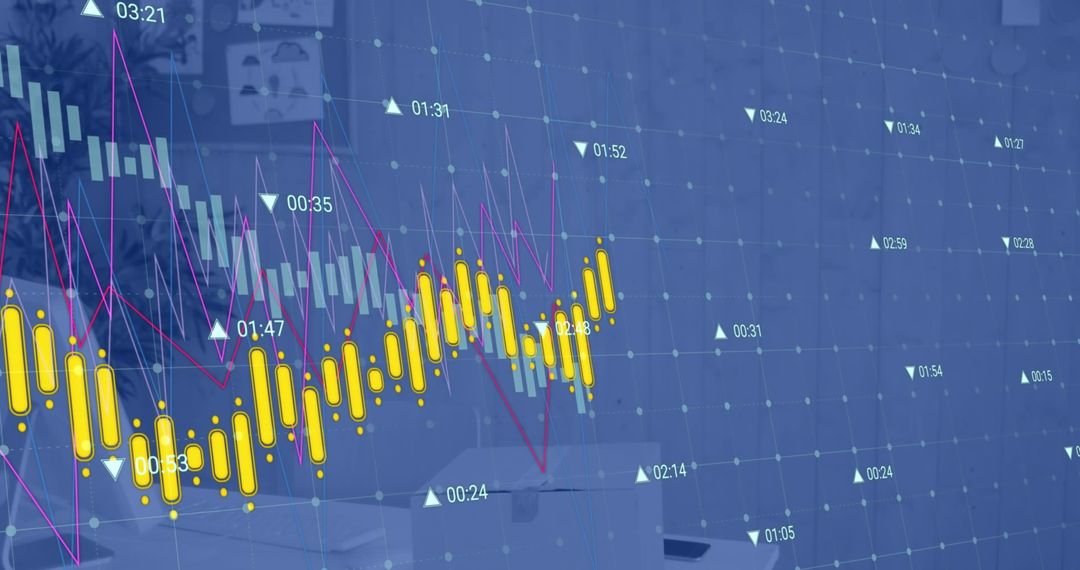
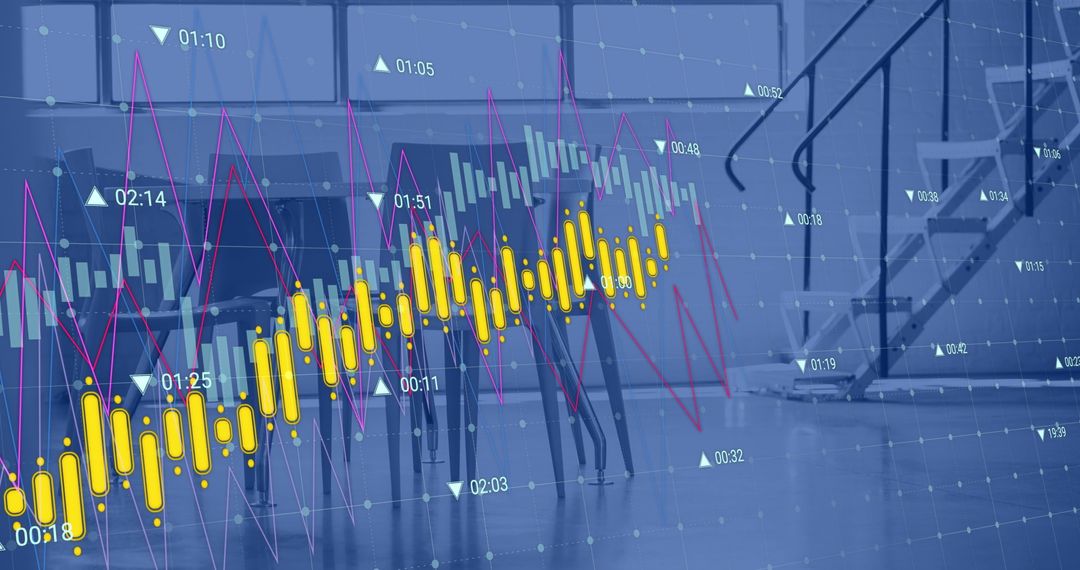
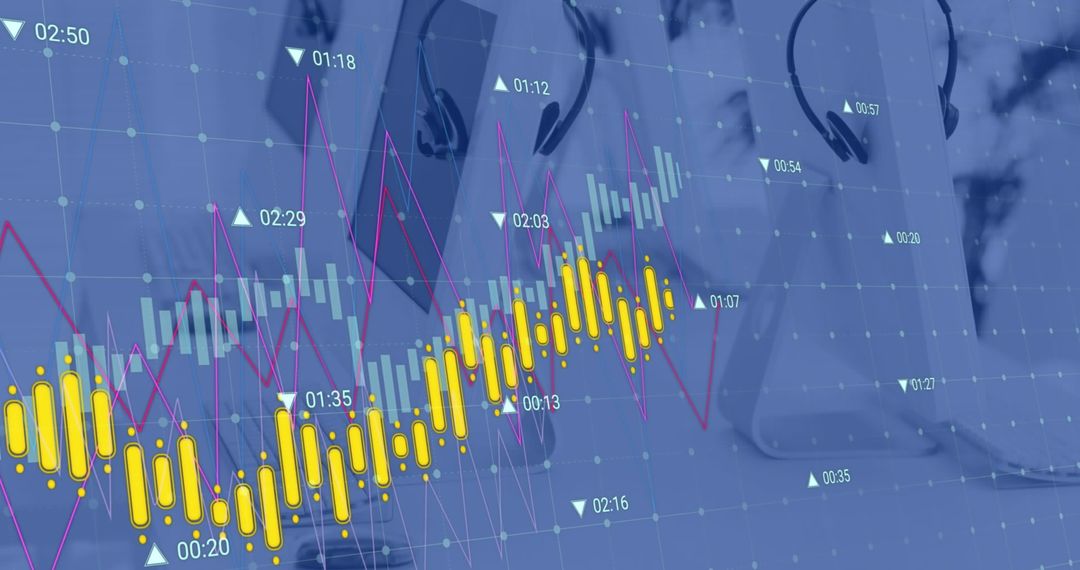
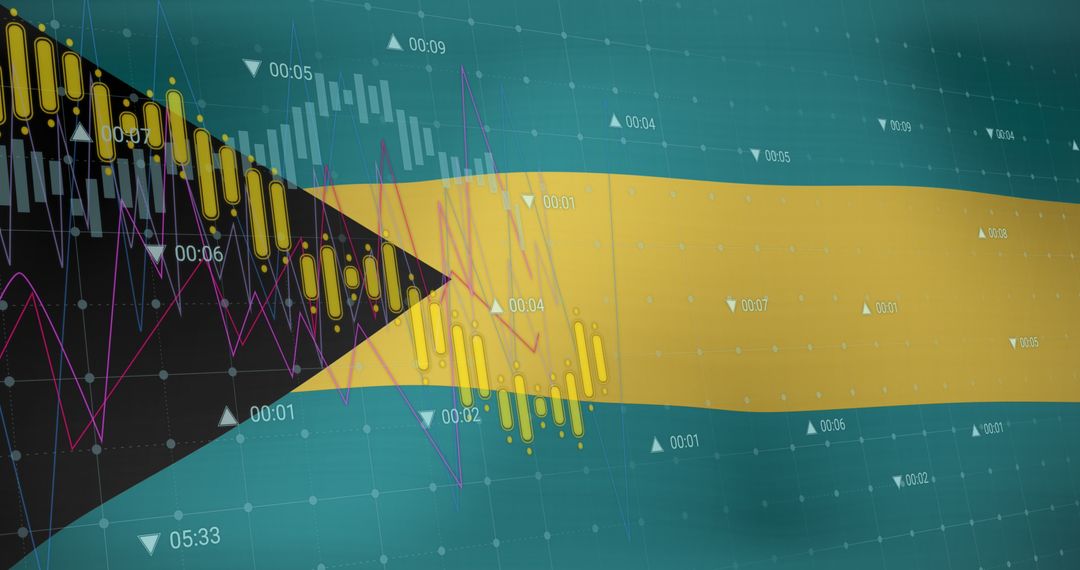
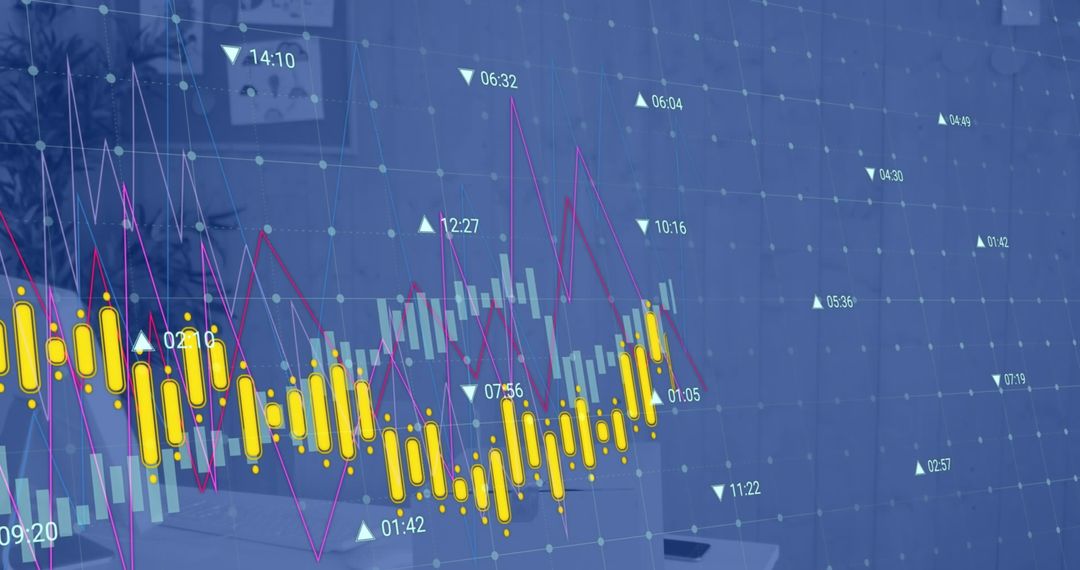
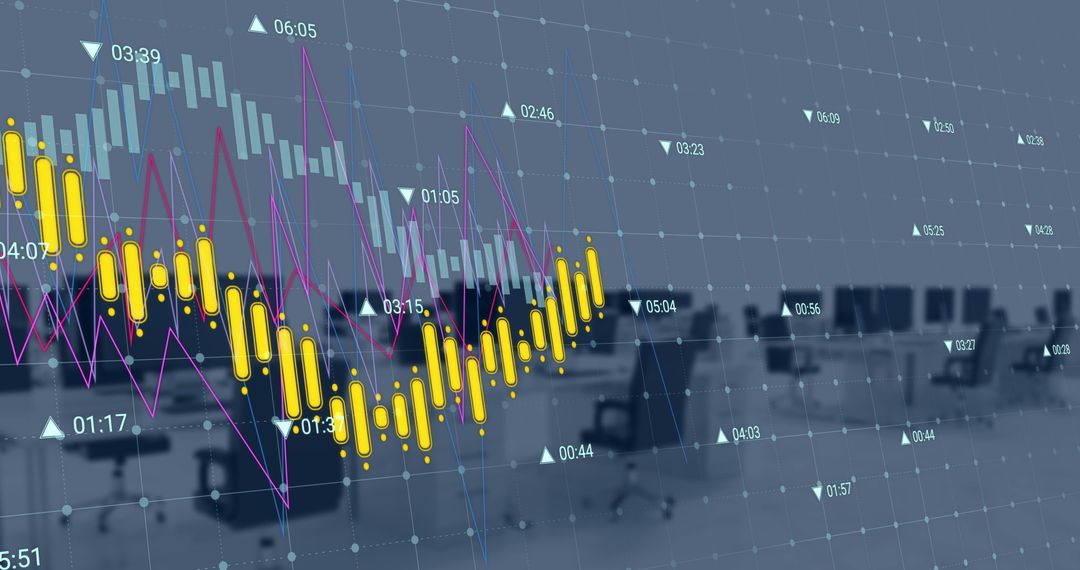
- Gold Bullion Overlapping Financial Data Visualization
Gold Bullion Overlapping Financial Data Visualization Image

Vivid display combining gold bullion with dynamic financial charts suggests investment opportunities in commodities markets. Ideal for blogs on finance, market analysis, and investment strategies. Perfect fit for financial institutions' campaigns, economic reports, and trading platforms.
Powered by  - Get 15% off with code: PIKWIZARD15


2
downloads
downloads
Tags:
More
Credit Photo
If you would like to credit the Photo, here are some ways you can do so
Text Link
photo Link
<span class="text-link">
<span>
<a target="_blank" href=https://pikwizard.com/photo/gold-bullion-overlapping-financial-data-visualization/03e1506c45f942d695a4826460a9713d/>PikWizard</a>
</span>
</span>
<span class="image-link">
<span
style="margin: 0 0 20px 0; display: inline-block; vertical-align: middle; width: 100%;"
>
<a
target="_blank"
href="https://pikwizard.com/photo/gold-bullion-overlapping-financial-data-visualization/03e1506c45f942d695a4826460a9713d/"
style="text-decoration: none; font-size: 10px; margin: 0;"
>
<img src="https://pikwizard.com/pw/medium/03e1506c45f942d695a4826460a9713d.jpg" style="margin: 0; width: 100%;" alt="" />
<p style="font-size: 12px; margin: 0;">PikWizard</p>
</a>
</span>
</span>
Free (free of charge)
Free for personal and commercial use.
Author: People Creations
Similar Free Stock Images

Premium


Premium


Premium


Premium


Premium


Premium


Premium


Premium


Premium


Premium


Premium


Premium


Premium


Premium


Premium


Premium


Premium


Premium


Premium


Premium


Premium


Premium


Premium


Premium