
- Home >
- Stock Photos >
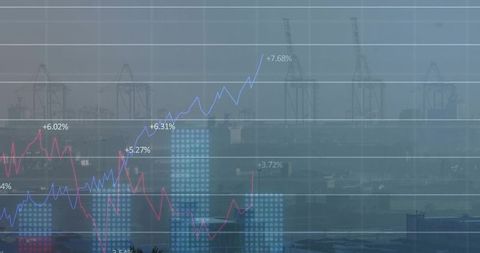
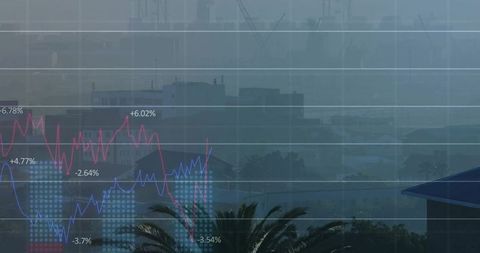
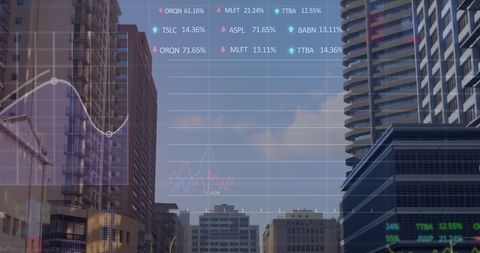
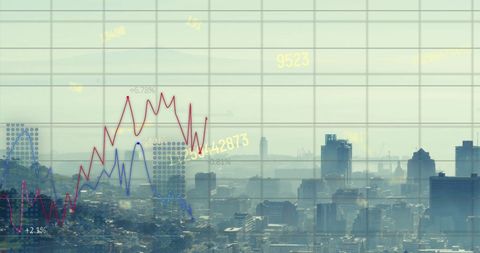
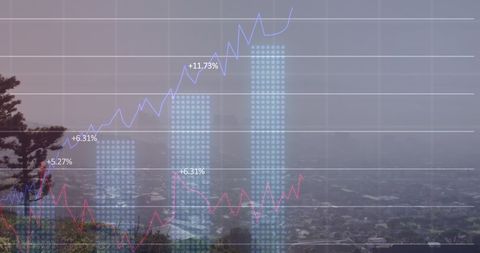
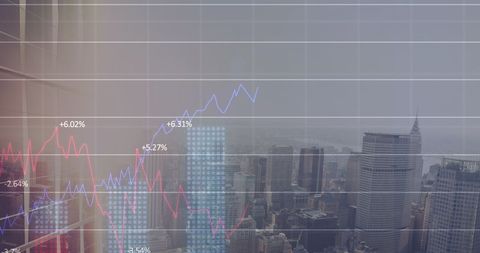
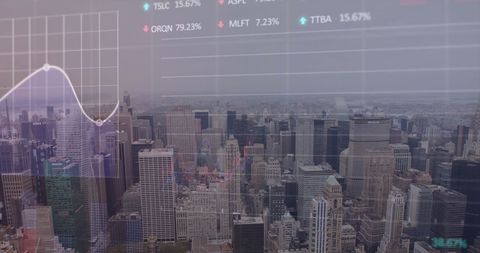
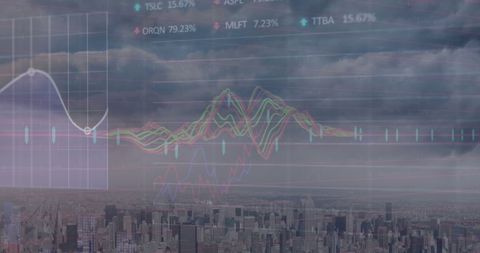
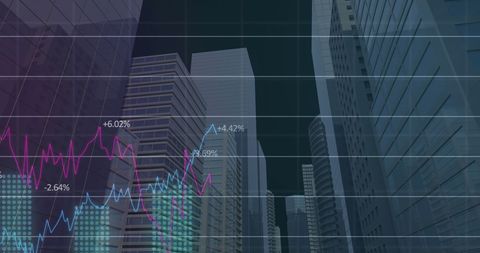
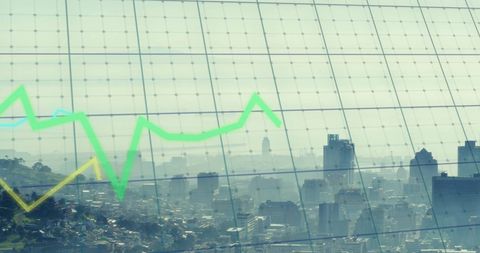
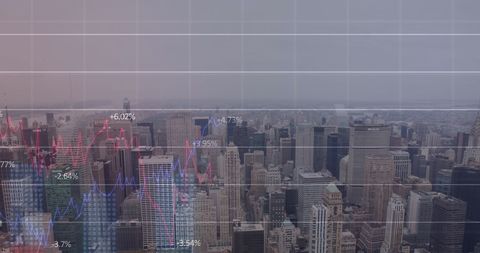
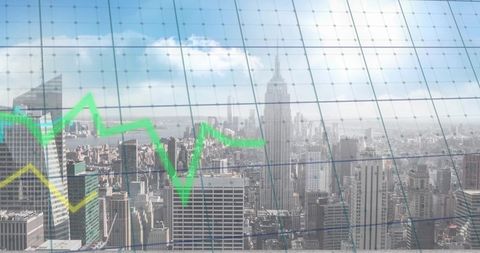
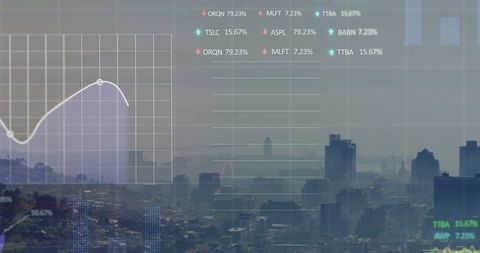
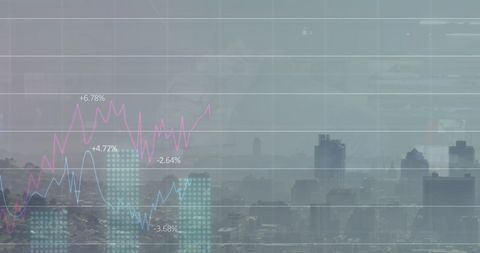
- Graph Analysis with Cityscape Background Visualizing Economic Trends
Graph Analysis with Cityscape Background Visualizing Economic Trends Image

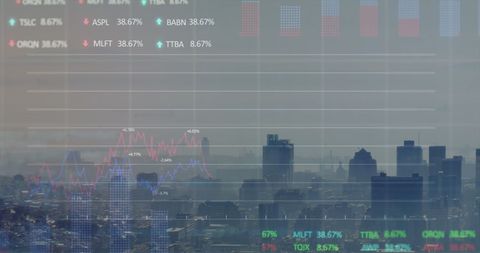
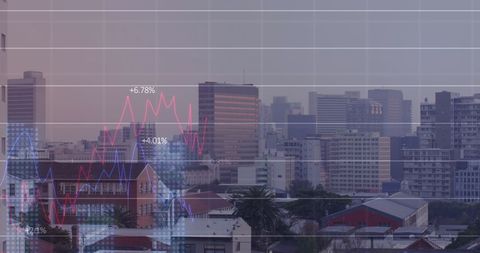
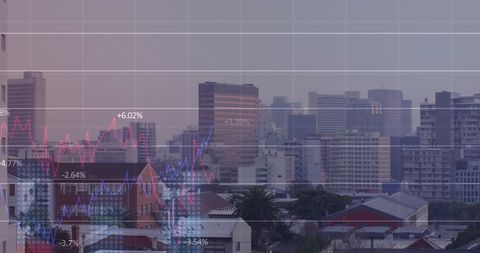
Graph analysis overlaying a city skyline emphasizes economic trends and market data relationships. Useful for visual storytelling related to financial growth, urban business insights, or economic seminars. Ideal for presentations about global markets or innovative business strategies.
Powered by 


downloads
Tags:
More
Credit Photo
If you would like to credit the Photo, here are some ways you can do so
Text Link
photo Link
<span class="text-link">
<span>
<a target="_blank" href=https://pikwizard.com/photo/graph-analysis-with-cityscape-background-visualizing-economic-trends/d45d697dbf70dfe98372598e26dab44c/>PikWizard</a>
</span>
</span>
<span class="image-link">
<span
style="margin: 0 0 20px 0; display: inline-block; vertical-align: middle; width: 100%;"
>
<a
target="_blank"
href="https://pikwizard.com/photo/graph-analysis-with-cityscape-background-visualizing-economic-trends/d45d697dbf70dfe98372598e26dab44c/"
style="text-decoration: none; font-size: 10px; margin: 0;"
>
<img src="https://pikwizard.com/pw/medium/d45d697dbf70dfe98372598e26dab44c.jpg" style="margin: 0; width: 100%;" alt="" />
<p style="font-size: 12px; margin: 0;">PikWizard</p>
</a>
</span>
</span>
Free (free of charge)
Free for personal and commercial use.
Author: Authentic Images
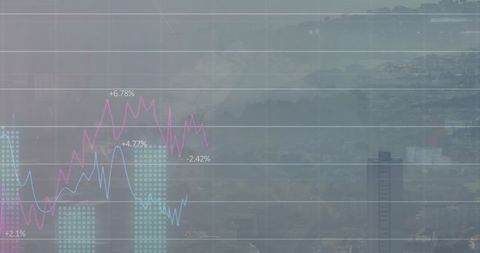
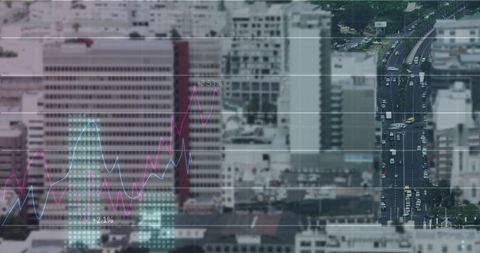
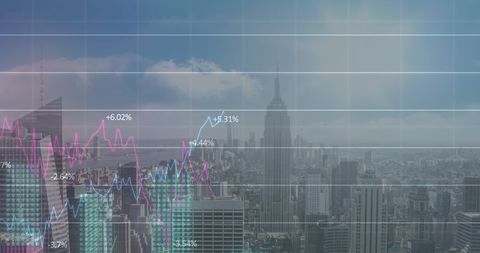
Similar Free Stock Images
Premium


Premium

Premium


Premium


Premium


Premium

Premium

Premium


Premium

Premium

Premium

Premium


Premium


Premium

Premium


Premium


Premium


Premium


Premium

Premium


Premium

Premium


Premium


Premium


Premium


Explore More Free Stock Images