- Home >
- Stock Photos >
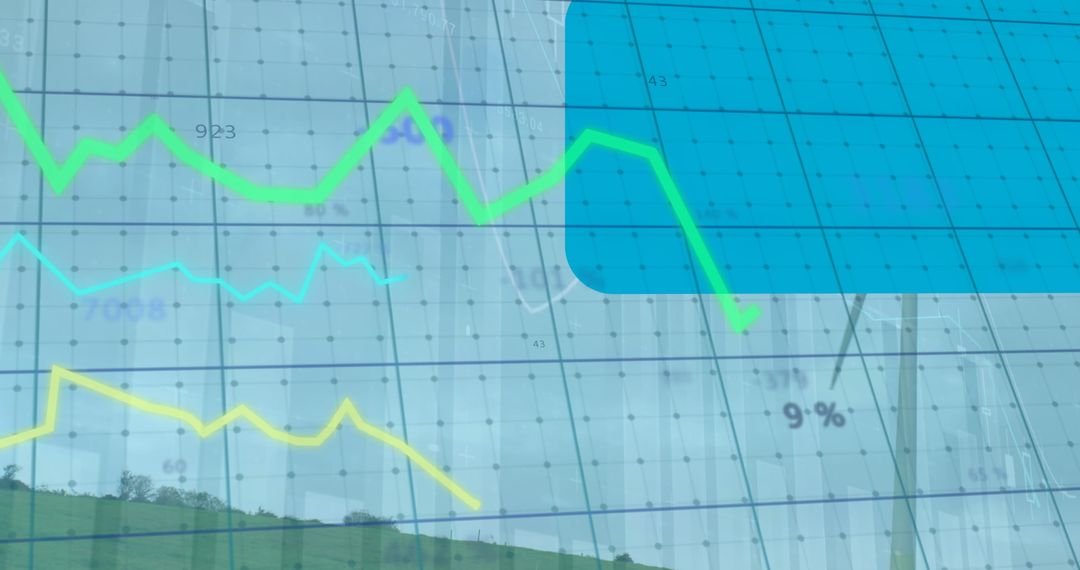
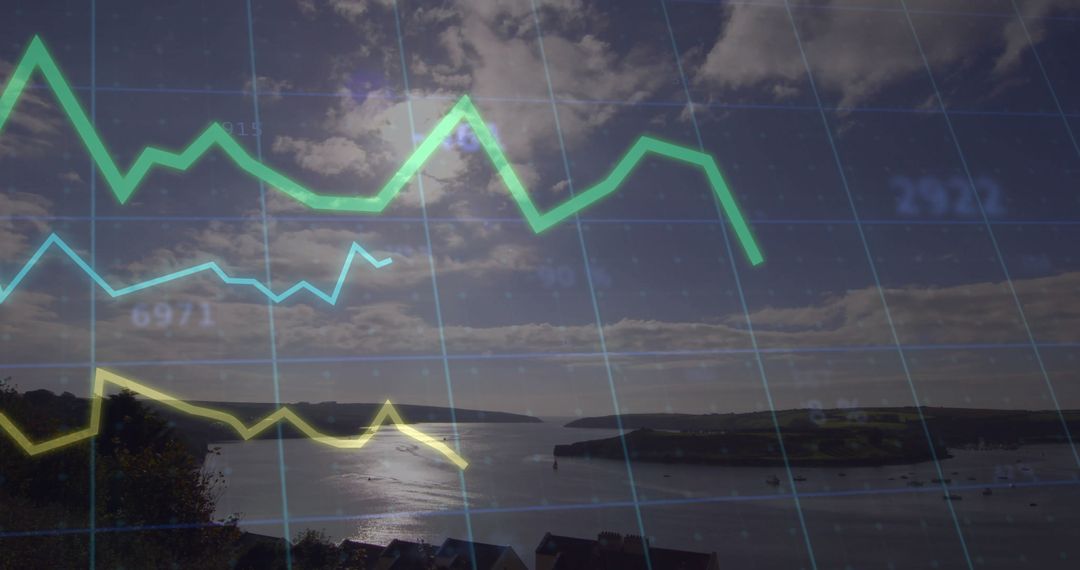
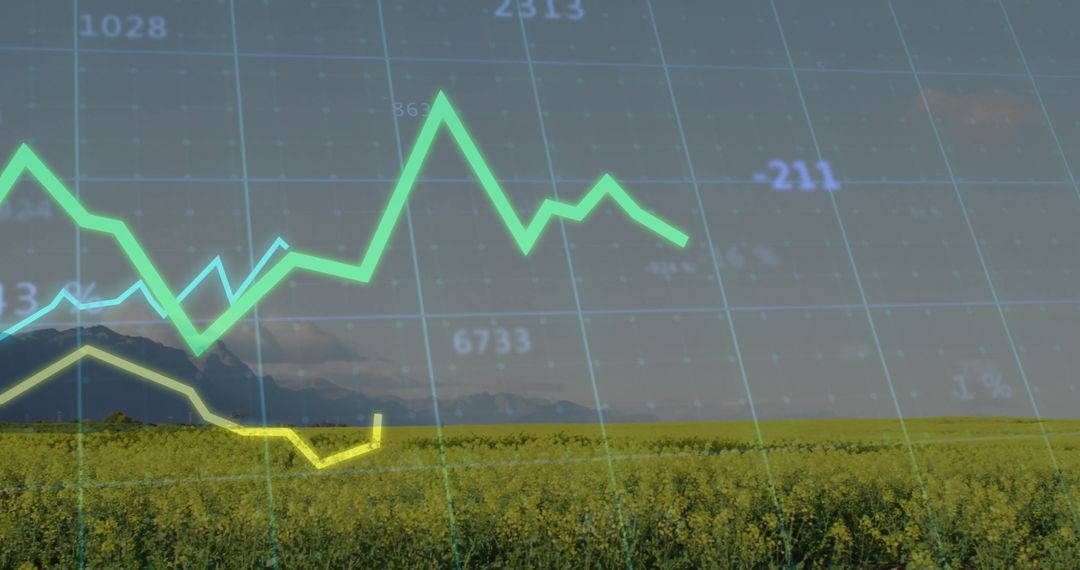
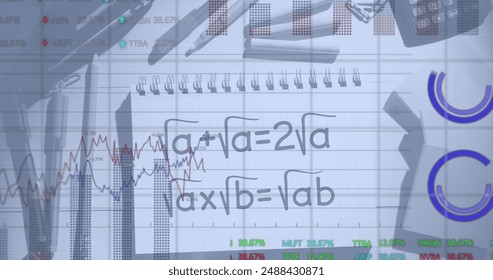
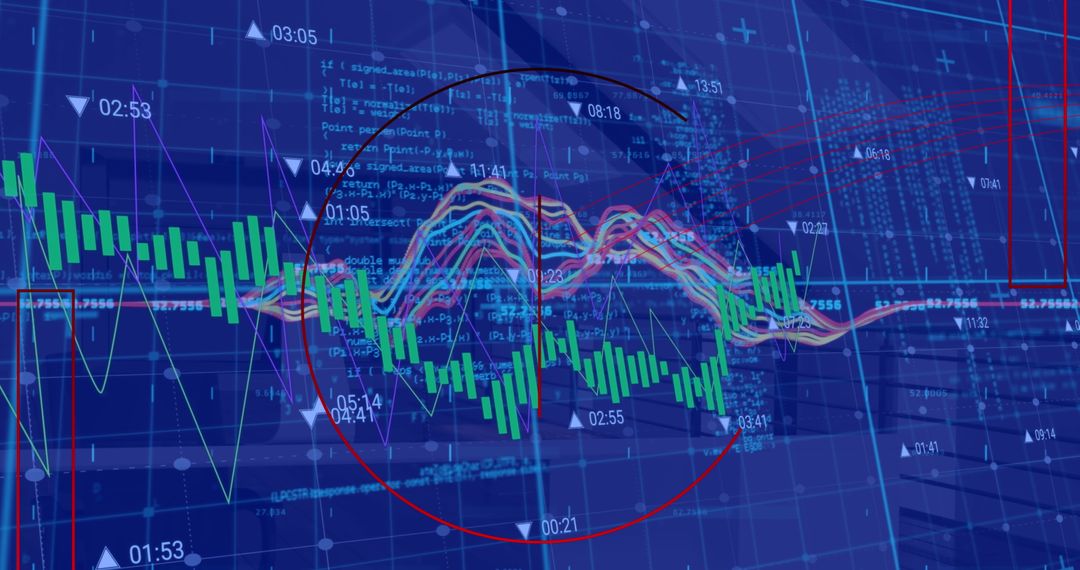
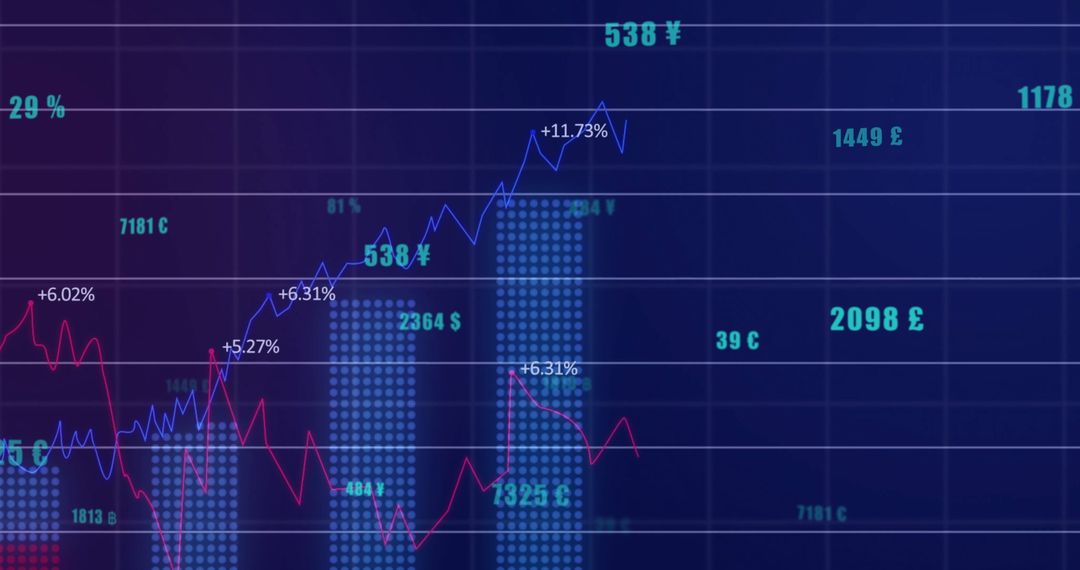
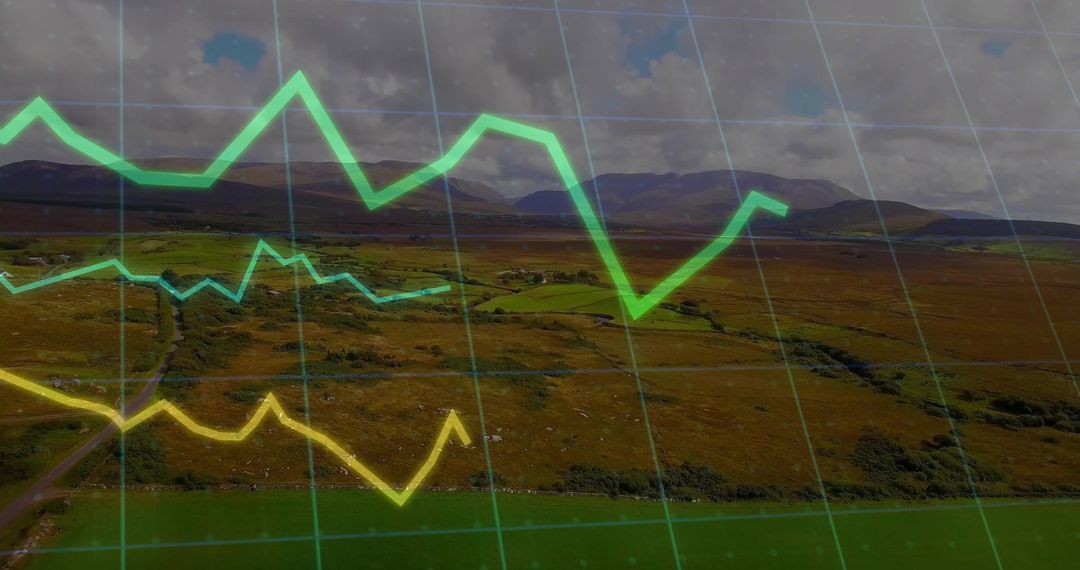
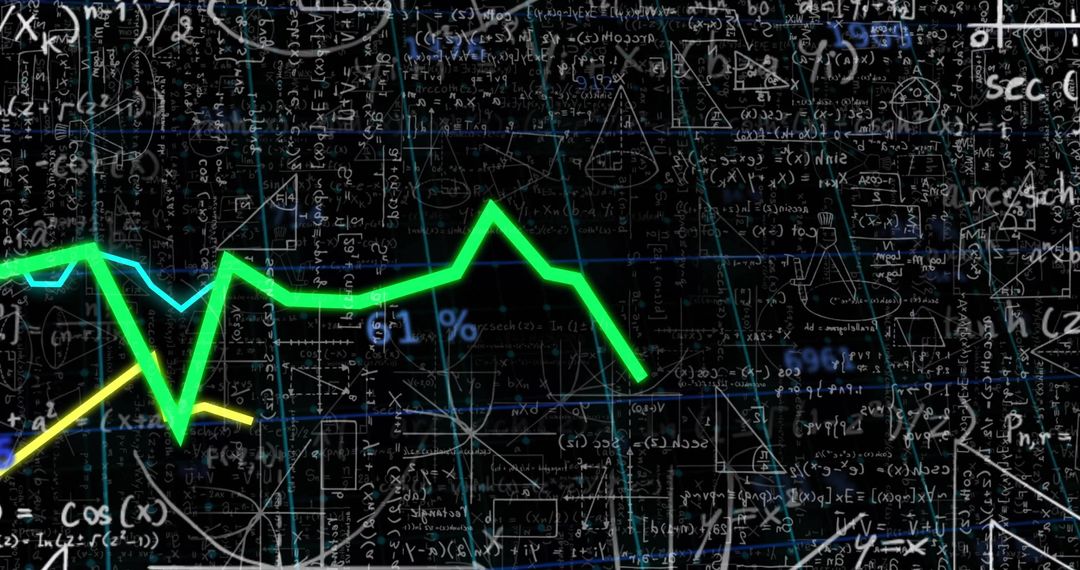
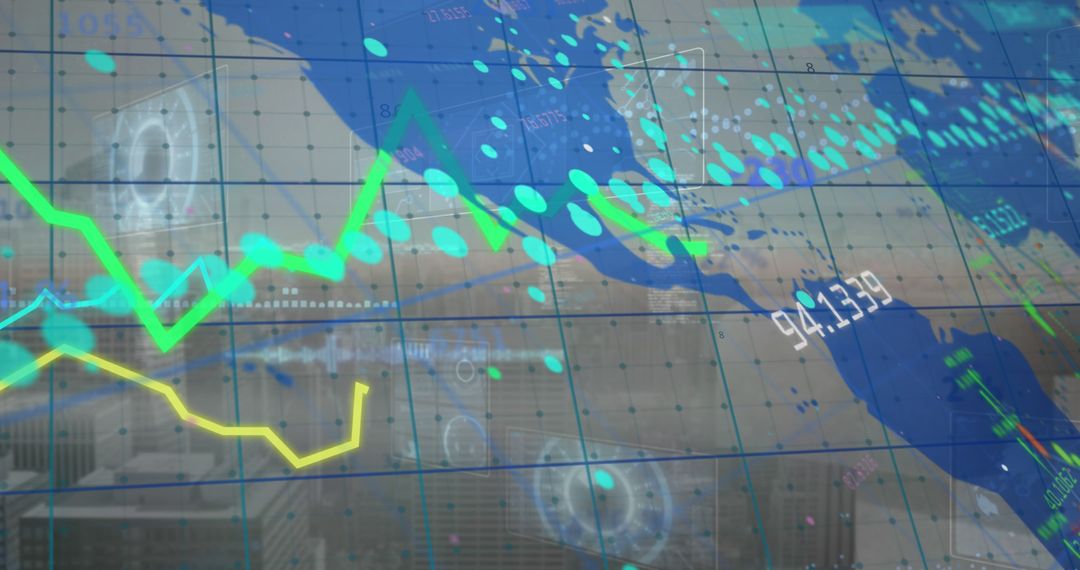
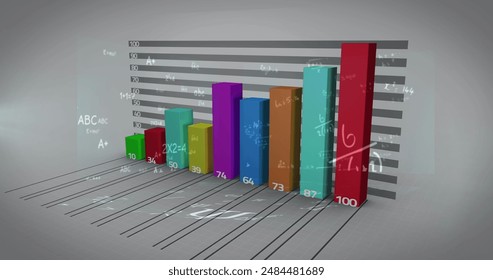
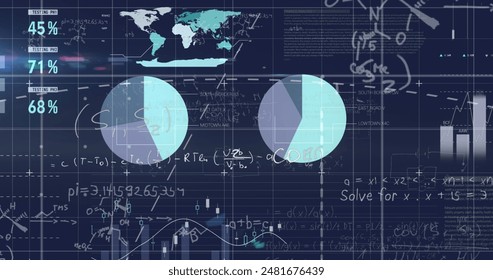
- Graph Analysis with Scientific and Mathematical Formulas Overlay
Graph Analysis with Scientific and Mathematical Formulas Overlay Image
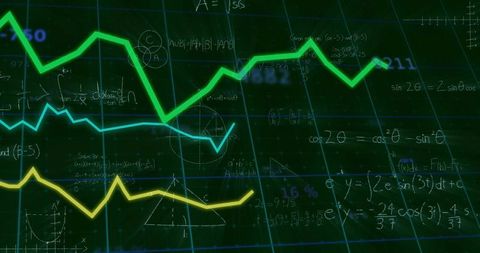
This digital illustration represents data trends and analytical insights with a vibrant visual of colorful graphs interlaced with mathematical formulas. The image's dynamic nature and sleek design allows it to be highly effective for educational purposes, tech presentations, data analysis forums, or documentation on advanced scientific study methods, enhancing understanding of complex systems in an engaging way.
Powered by  - Get 15% off with code: PIKWIZARD15


0
downloads
downloads
Tags:
More
Credit Photo
If you would like to credit the Photo, here are some ways you can do so
Text Link
photo Link
<span class="text-link">
<span>
<a target="_blank" href=https://pikwizard.com/photo/graph-analysis-with-scientific-and-mathematical-formulas-overlay/c6cae937255415d9c0ea756dd3961144/>PikWizard</a>
</span>
</span>
<span class="image-link">
<span
style="margin: 0 0 20px 0; display: inline-block; vertical-align: middle; width: 100%;"
>
<a
target="_blank"
href="https://pikwizard.com/photo/graph-analysis-with-scientific-and-mathematical-formulas-overlay/c6cae937255415d9c0ea756dd3961144/"
style="text-decoration: none; font-size: 10px; margin: 0;"
>
<img src="https://pikwizard.com/pw/medium/c6cae937255415d9c0ea756dd3961144.jpg" style="margin: 0; width: 100%;" alt="" />
<p style="font-size: 12px; margin: 0;">PikWizard</p>
</a>
</span>
</span>
Free (free of charge)
Free for personal and commercial use.
Author: Creative Art
Similar Free Stock Images

Premium


Premium


Premium


Premium


Premium


Premium


Premium