- Home >
- Stock Photos >
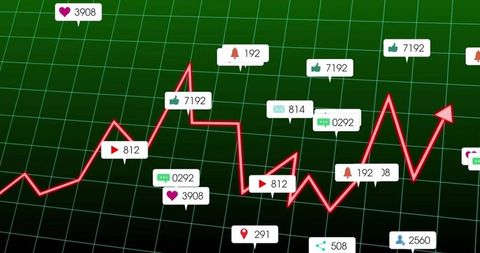
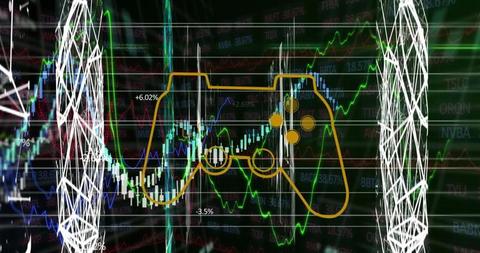
- Graph Charting Upward and Downward Financial Trends
Graph Charting Upward and Downward Financial Trends Image
Graph showcasing financial trends with two lines representing data changes over time. The upward momentum reaches a peak followed by a decline, amidst various numerical data points on the screen. Useful for presentations on stock market trends, investment strategies, or economic analysis by showcasing dynamics in data movements.
Powered by 


0
downloads
downloads
Tags:
More
Credit Photo
If you would like to credit the Photo, here are some ways you can do so
Text Link
photo Link
<span class="text-link">
<span>
<a target="_blank" href=https://pikwizard.com/photo/graph-charting-upward-and-downward-financial-trends/b4987da954b7c98b25a27cd79926e353/>PikWizard</a>
</span>
</span>
<span class="image-link">
<span
style="margin: 0 0 20px 0; display: inline-block; vertical-align: middle; width: 100%;"
>
<a
target="_blank"
href="https://pikwizard.com/photo/graph-charting-upward-and-downward-financial-trends/b4987da954b7c98b25a27cd79926e353/"
style="text-decoration: none; font-size: 10px; margin: 0;"
>
<img src="https://pikwizard.com/pw/medium/b4987da954b7c98b25a27cd79926e353.jpg" style="margin: 0; width: 100%;" alt="" />
<p style="font-size: 12px; margin: 0;">PikWizard</p>
</a>
</span>
</span>
Free (free of charge)
Free for personal and commercial use.
Author: Authentic Images
Similar Free Stock Images
Loading...

Premium


Premium


Premium


Premium


Premium


Premium


Premium

Premium

Premium


Premium

Premium


Premium


Premium

Premium


Premium


Premium

Premium


Premium


Premium


Premium


Premium

Premium


Premium


Premium


Premium