
- Home >
- Stock Photos >
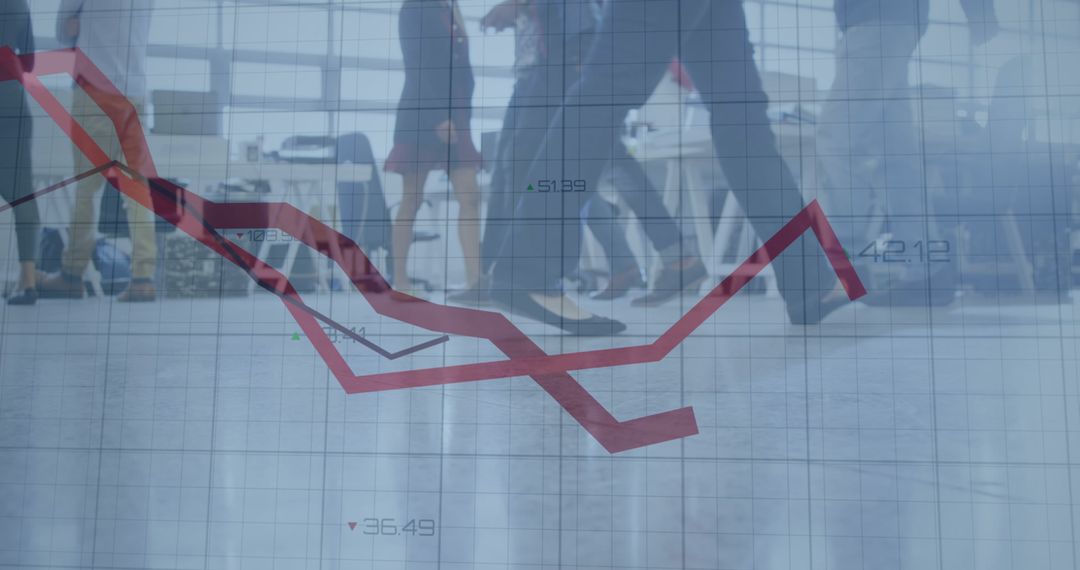
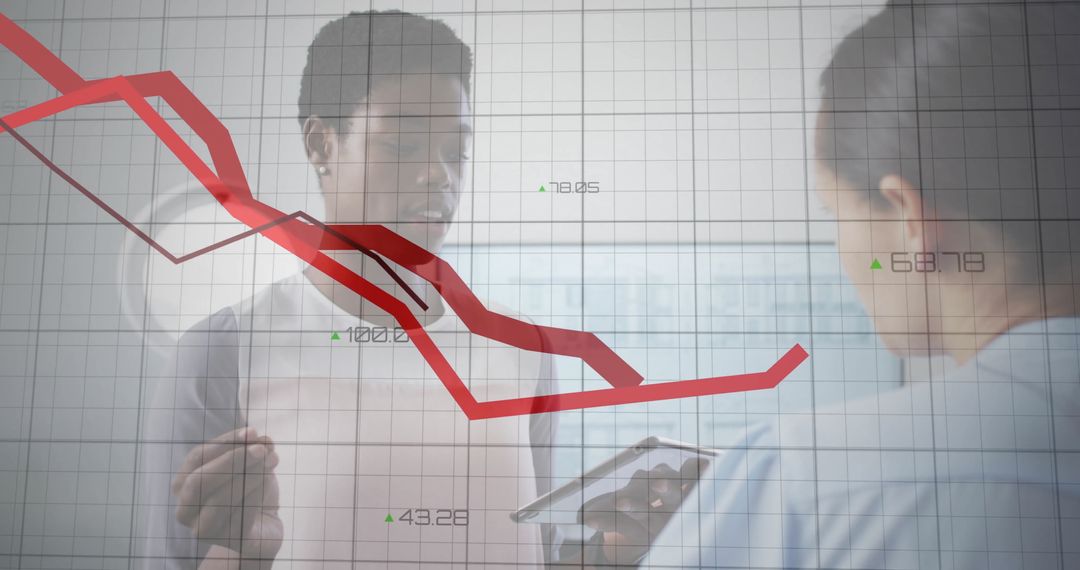
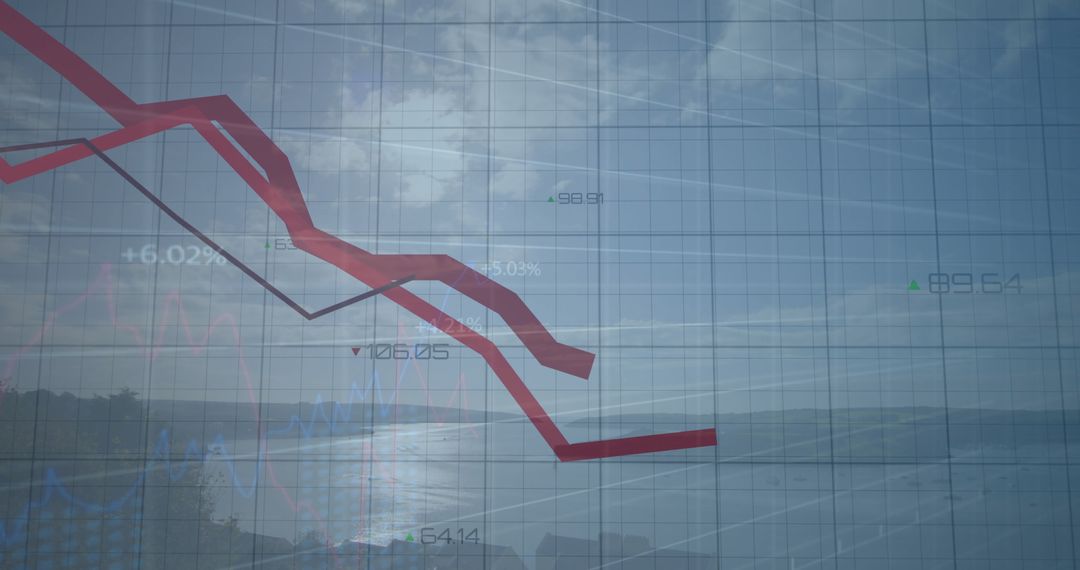
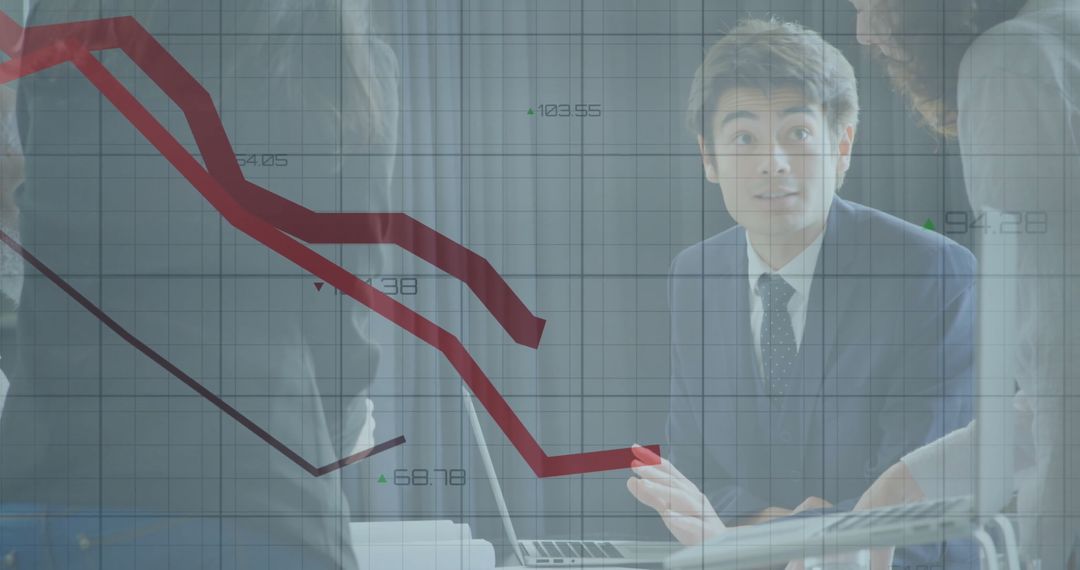
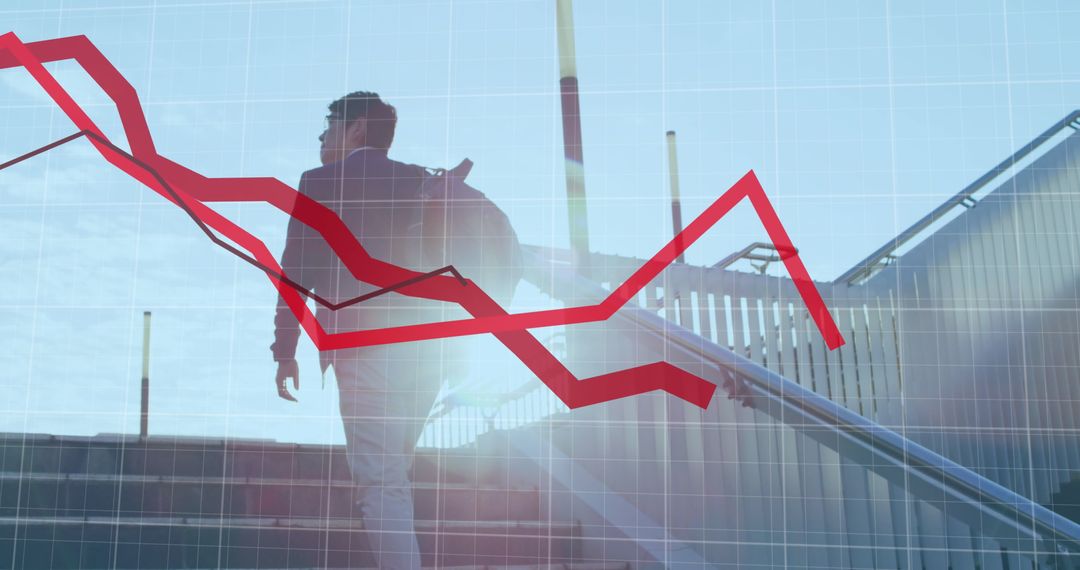
- Graph Decline with Businessman Reflected in Economic Concept
Graph Decline with Businessman Reflected in Economic Concept Image

This visual illustrates a red downward-trending graph overlaid on a reflective backdrop of a businessman, signifying an economic downturn or financial instability. Useful for depicting concepts related to market analysis, financial crisis, investment decline, or global economic trends. Ideal for articles discussing recession impacts, business strategy revisions, or market predictions.
Powered by  - Get 15% off with code: PIKWIZARD15


2
downloads
downloads
Tags:
More
Credit Photo
If you would like to credit the Photo, here are some ways you can do so
Text Link
photo Link
<span class="text-link">
<span>
<a target="_blank" href=https://pikwizard.com/photo/graph-decline-with-businessman-reflected-in-economic-concept/b9977734be36b4cc8976fa34dc25bf31/>PikWizard</a>
</span>
</span>
<span class="image-link">
<span
style="margin: 0 0 20px 0; display: inline-block; vertical-align: middle; width: 100%;"
>
<a
target="_blank"
href="https://pikwizard.com/photo/graph-decline-with-businessman-reflected-in-economic-concept/b9977734be36b4cc8976fa34dc25bf31/"
style="text-decoration: none; font-size: 10px; margin: 0;"
>
<img src="https://pikwizard.com/pw/medium/b9977734be36b4cc8976fa34dc25bf31.jpg" style="margin: 0; width: 100%;" alt="" />
<p style="font-size: 12px; margin: 0;">PikWizard</p>
</a>
</span>
</span>
Free (free of charge)
Free for personal and commercial use.
Author: Authentic Images
Similar Free Stock Images

Premium


Premium


Premium


Premium


Premium


Premium


Premium


Premium


Premium


Premium


Premium


Premium


Premium


Premium


Premium


Premium


Premium


Premium


Premium


Premium


Premium


Premium


Premium


Premium

