- Home >
- Stock Photos >
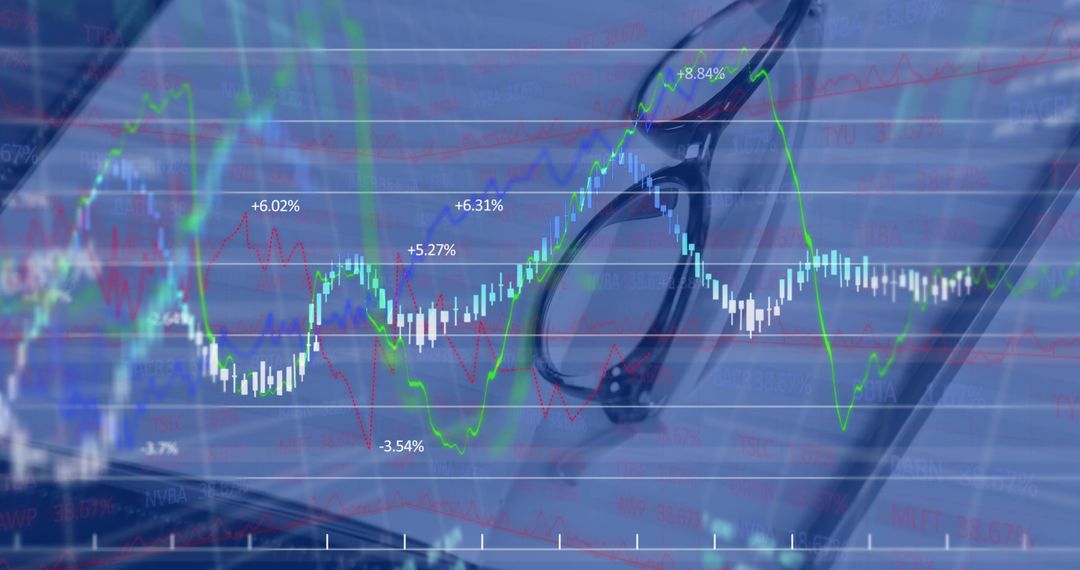
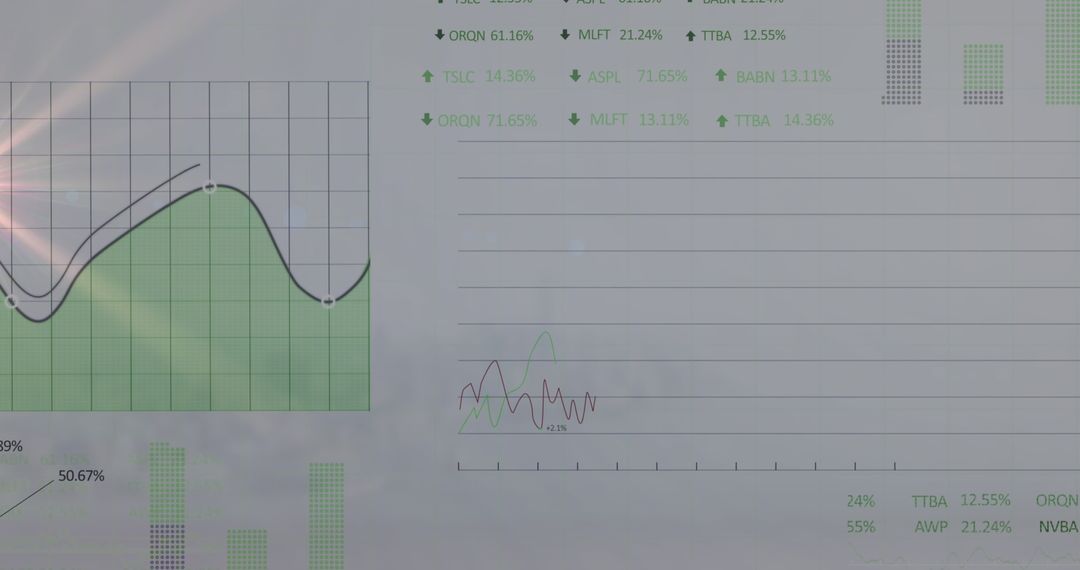
- Graph Overlay on Notebook with Glasses on Desk
Graph Overlay on Notebook with Glasses on Desk Image

Showcasing a digital graph overlay on an open notebook with glasses positioned beside it on a desk. This concept embodies the intersection of traditional note-taking and modern data analytics, implying themes of research, study, financial planning, or business strategy. Ideal for use in articles or presentations related to statistics, market research, digital transformation, or academic studies.
Powered by 


2
downloads
downloads
Tags:
More
Credit Photo
If you would like to credit the Photo, here are some ways you can do so
Text Link
photo Link
<span class="text-link">
<span>
<a target="_blank" href=https://pikwizard.com/photo/graph-overlay-on-notebook-with-glasses-on-desk/4472bfcf75fb4f85957821d8f2b5ad09/>PikWizard</a>
</span>
</span>
<span class="image-link">
<span
style="margin: 0 0 20px 0; display: inline-block; vertical-align: middle; width: 100%;"
>
<a
target="_blank"
href="https://pikwizard.com/photo/graph-overlay-on-notebook-with-glasses-on-desk/4472bfcf75fb4f85957821d8f2b5ad09/"
style="text-decoration: none; font-size: 10px; margin: 0;"
>
<img src="https://pikwizard.com/pw/medium/4472bfcf75fb4f85957821d8f2b5ad09.jpg" style="margin: 0; width: 100%;" alt="" />
<p style="font-size: 12px; margin: 0;">PikWizard</p>
</a>
</span>
</span>
Free (free of charge)
Free for personal and commercial use.
Author: Awesome Content
Similar Free Stock Images

Premium


Premium


Premium


Premium


Premium


Premium


Premium


Premium


Premium


Premium


Premium


Premium


Premium


Premium


Premium


Premium


Premium


Premium


Premium


Premium


Premium


Premium


Premium


Premium