- Home >
- Stock Photos >
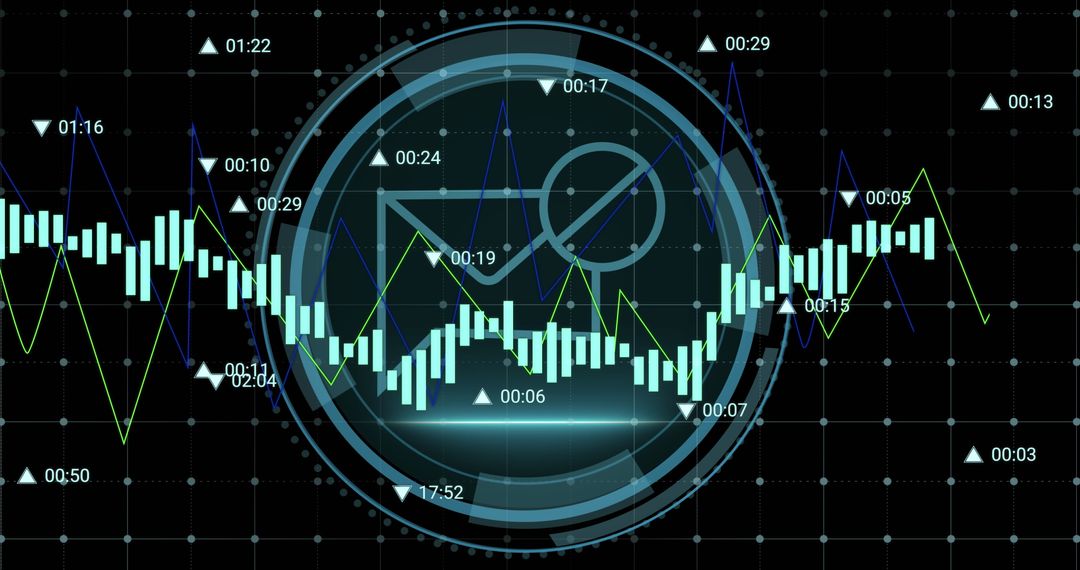
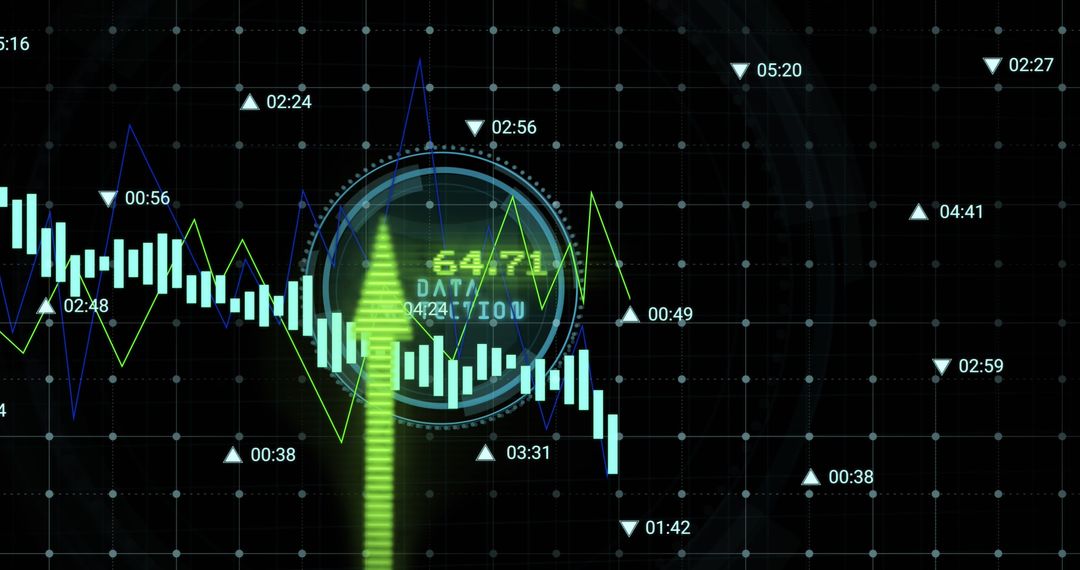
- Graph Showing Stock Market Activity and Financial Data Analysis
Graph Showing Stock Market Activity and Financial Data Analysis Image

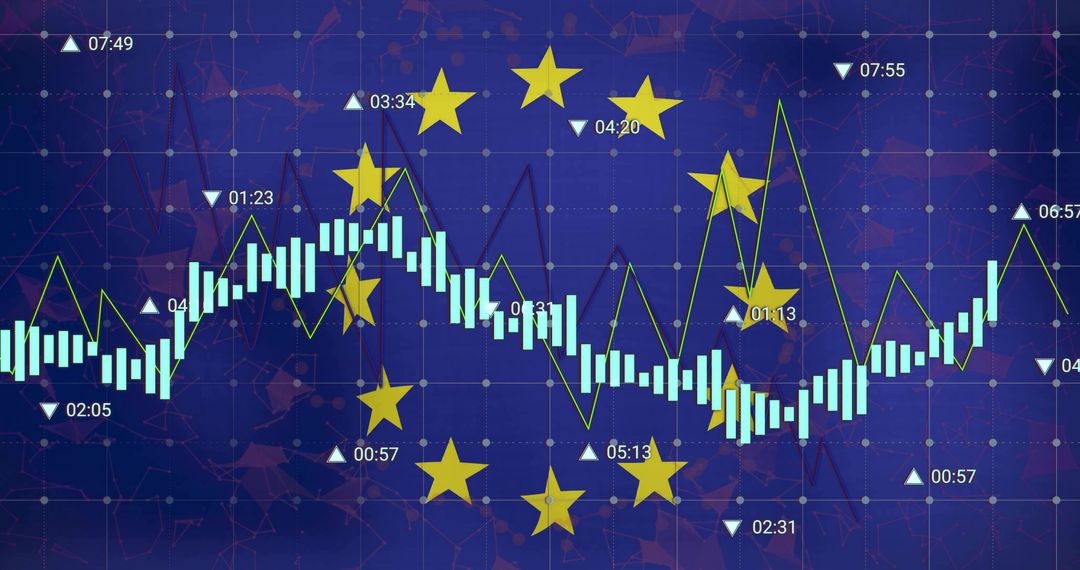
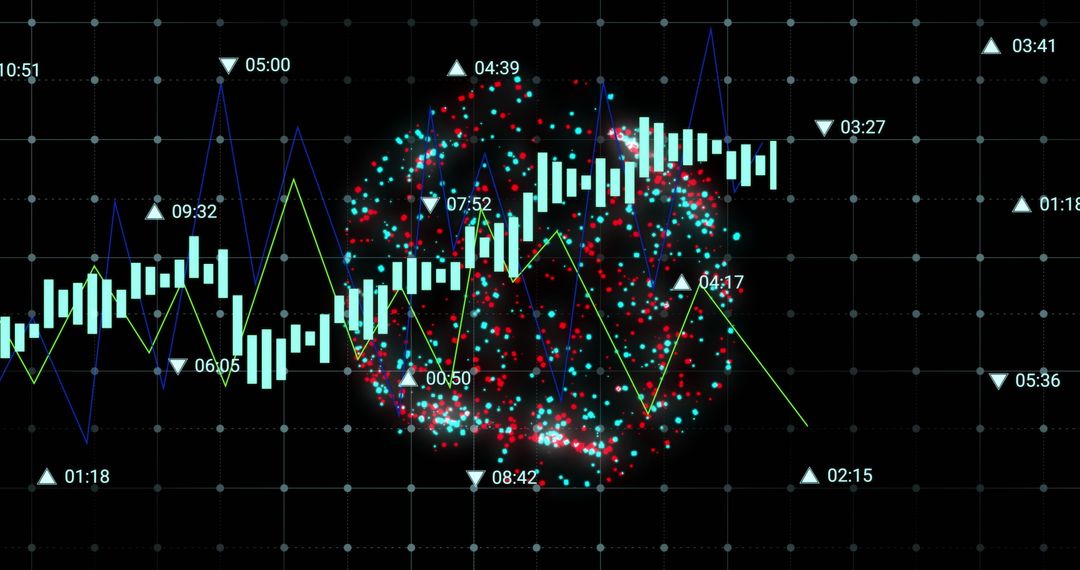
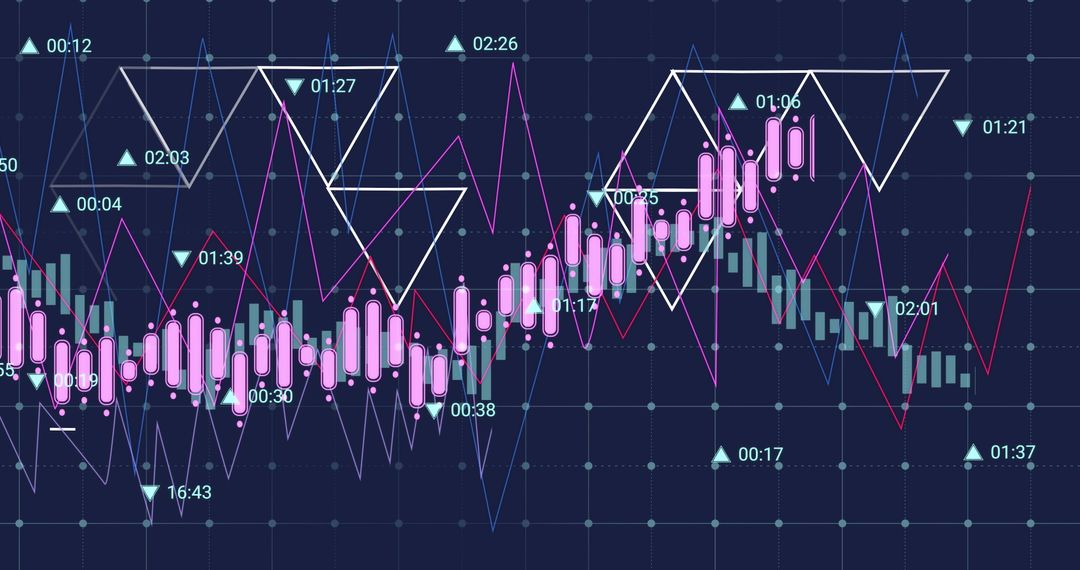
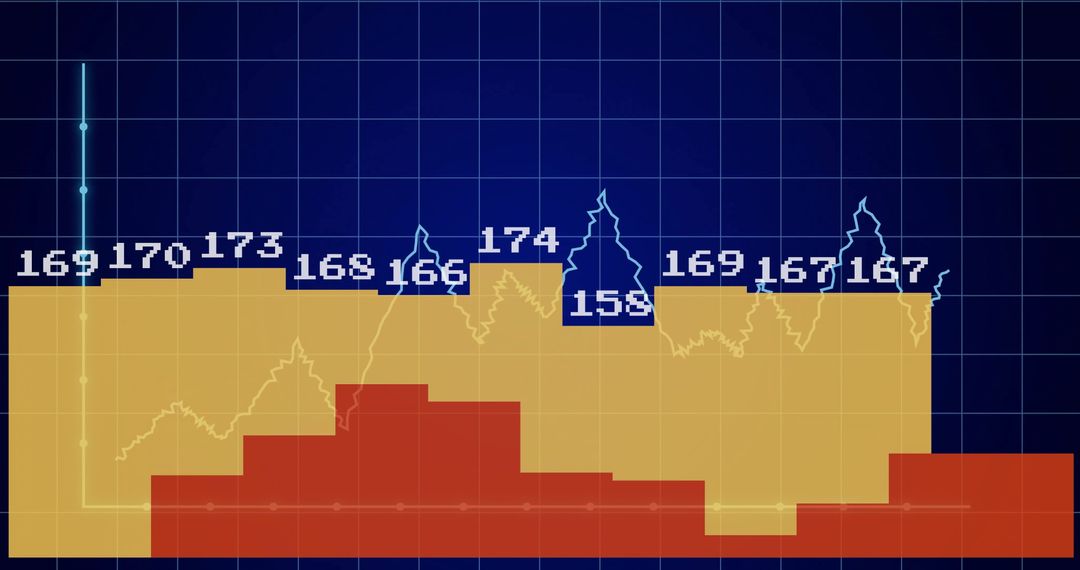
Digitally generated display of stock market activity showcasing financial data analysis. The design prominently shows fluctuating line graphs and various index markers against a dark background, symbolizing dynamic financial trends and insights. Useful for presentations on financial forecasting, economic analysis, or investment consultations.
Powered by 


2
downloads
downloads
Tags:
More
Credit Photo
If you would like to credit the Photo, here are some ways you can do so
Text Link
photo Link
<span class="text-link">
<span>
<a target="_blank" href=https://pikwizard.com/photo/graph-showing-stock-market-activity-and-financial-data-analysis/0660ead64990a90686e08e30eb8e5cbd/>PikWizard</a>
</span>
</span>
<span class="image-link">
<span
style="margin: 0 0 20px 0; display: inline-block; vertical-align: middle; width: 100%;"
>
<a
target="_blank"
href="https://pikwizard.com/photo/graph-showing-stock-market-activity-and-financial-data-analysis/0660ead64990a90686e08e30eb8e5cbd/"
style="text-decoration: none; font-size: 10px; margin: 0;"
>
<img src="https://pikwizard.com/pw/medium/0660ead64990a90686e08e30eb8e5cbd.jpg" style="margin: 0; width: 100%;" alt="" />
<p style="font-size: 12px; margin: 0;">PikWizard</p>
</a>
</span>
</span>
Free (free of charge)
Free for personal and commercial use.
Author: Awesome Content
Similar Free Stock Images

Premium


Premium


Premium


Premium


Premium


Premium


Premium


Premium


Premium


Premium


Premium


Premium


Premium


Premium


Premium


Premium


Premium


Premium


Premium


Premium


Premium


Premium


Premium


Premium