
- Home >
- Stock Photos >
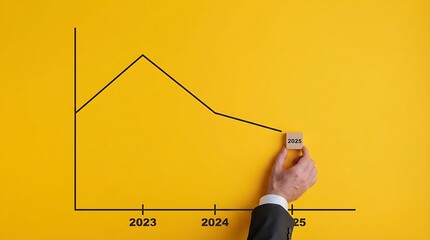
- Graph Visualizing Economic Downtrend and Financial Data
Graph Visualizing Economic Downtrend and Financial Data Image

Illustration shows several red lines graphically illustrating a downward trend on a grid. It represents declining or negative trends in global financial markets or business performance, and can be used in financial reports, articles on economic recessions, or discussions of investment strategies. The clean grid and the stark contrast of red lines convey a clear message of a downturn, suitable for presentations on market analysis or forecasting under challenging economic environments.
Powered by 


downloads
Tags:
More
Credit Photo
If you would like to credit the Photo, here are some ways you can do so
Text Link
photo Link
<span class="text-link">
<span>
<a target="_blank" href=https://pikwizard.com/photo/graph-visualizing-economic-downtrend-and-financial-data/19119fe91e1f8b2c40d90146f952b60f/>PikWizard</a>
</span>
</span>
<span class="image-link">
<span
style="margin: 0 0 20px 0; display: inline-block; vertical-align: middle; width: 100%;"
>
<a
target="_blank"
href="https://pikwizard.com/photo/graph-visualizing-economic-downtrend-and-financial-data/19119fe91e1f8b2c40d90146f952b60f/"
style="text-decoration: none; font-size: 10px; margin: 0;"
>
<img src="https://pikwizard.com/pw/medium/19119fe91e1f8b2c40d90146f952b60f.jpg" style="margin: 0; width: 100%;" alt="" />
<p style="font-size: 12px; margin: 0;">PikWizard</p>
</a>
</span>
</span>
Free (free of charge)
Free for personal and commercial use.
Author: Authentic Images
Similar Free Stock Images

Premium


Premium

Premium


Premium


Premium


Premium


Premium


Premium
Premium


Premium


Premium


Premium


Premium


Premium


Premium


Premium


Premium


Premium


Premium


Premium

Premium


Premium


Premium


Premium


Premium


Explore More Free Stock Images