- Home >
- Stock Photos >
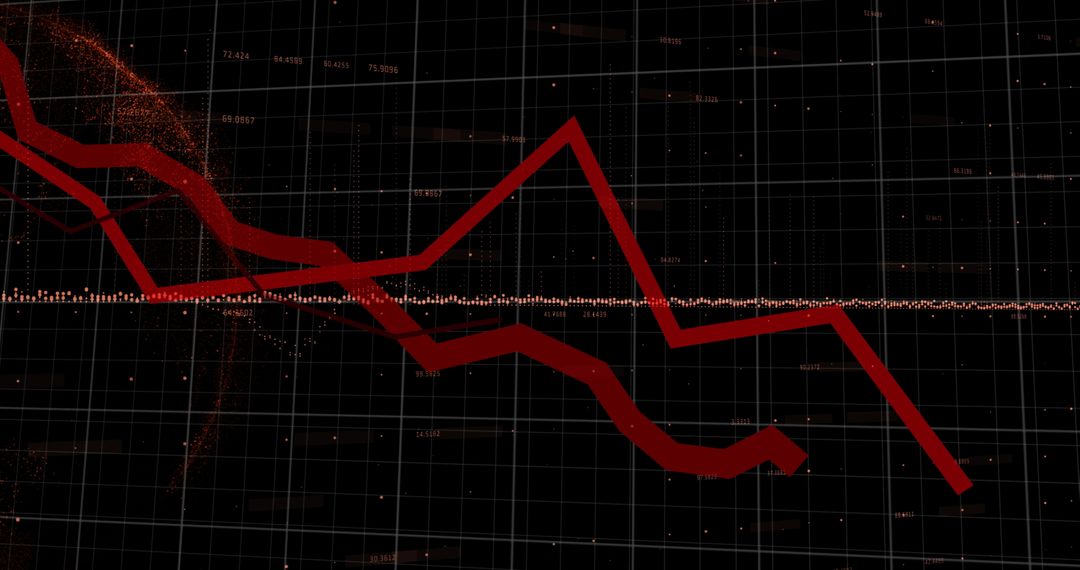
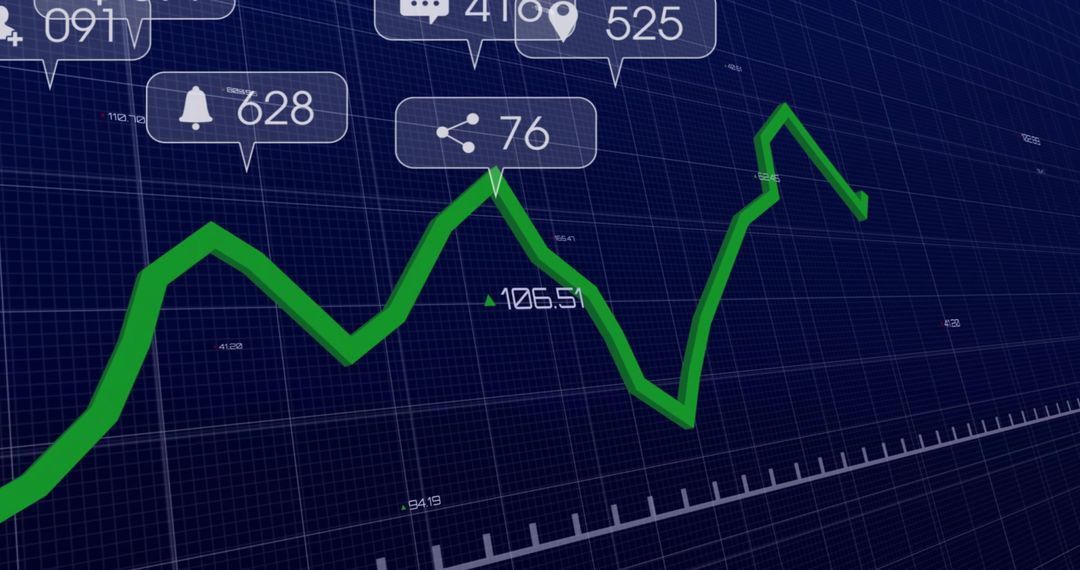
- Graph with Bar and Line Trends on Digital Grid Background
Graph with Bar and Line Trends on Digital Grid Background Image

Graph showing overlapping bar and line charts on navy digital grid, representing data analysis or statistics. Useful for illustrating concepts in finance, economy, research, and data-driven technologies. Ideal for articles, presentations, or educational materials on trends and business growth analysis.
Powered by  - Get 15% off with code: PIKWIZARD15


2
downloads
downloads
Tags:
More
Credit Photo
If you would like to credit the Photo, here are some ways you can do so
Text Link
photo Link
<span class="text-link">
<span>
<a target="_blank" href=https://pikwizard.com/photo/graph-with-bar-and-line-trends-on-digital-grid-background/d877c83827a5d812aaaf94b471a98de1/>PikWizard</a>
</span>
</span>
<span class="image-link">
<span
style="margin: 0 0 20px 0; display: inline-block; vertical-align: middle; width: 100%;"
>
<a
target="_blank"
href="https://pikwizard.com/photo/graph-with-bar-and-line-trends-on-digital-grid-background/d877c83827a5d812aaaf94b471a98de1/"
style="text-decoration: none; font-size: 10px; margin: 0;"
>
<img src="https://pikwizard.com/pw/medium/d877c83827a5d812aaaf94b471a98de1.jpg" style="margin: 0; width: 100%;" alt="" />
<p style="font-size: 12px; margin: 0;">PikWizard</p>
</a>
</span>
</span>
Free (free of charge)
Free for personal and commercial use.
Author: Authentic Images
Similar Free Stock Images

Premium


Premium


Premium


Premium


Premium


Premium


Premium


Premium


Premium


Premium


Premium


Premium


Premium


Premium


Premium


Premium


Premium


Premium


Premium


Premium


Premium


Premium


Premium


Premium