- Home >
- Stock Photos >
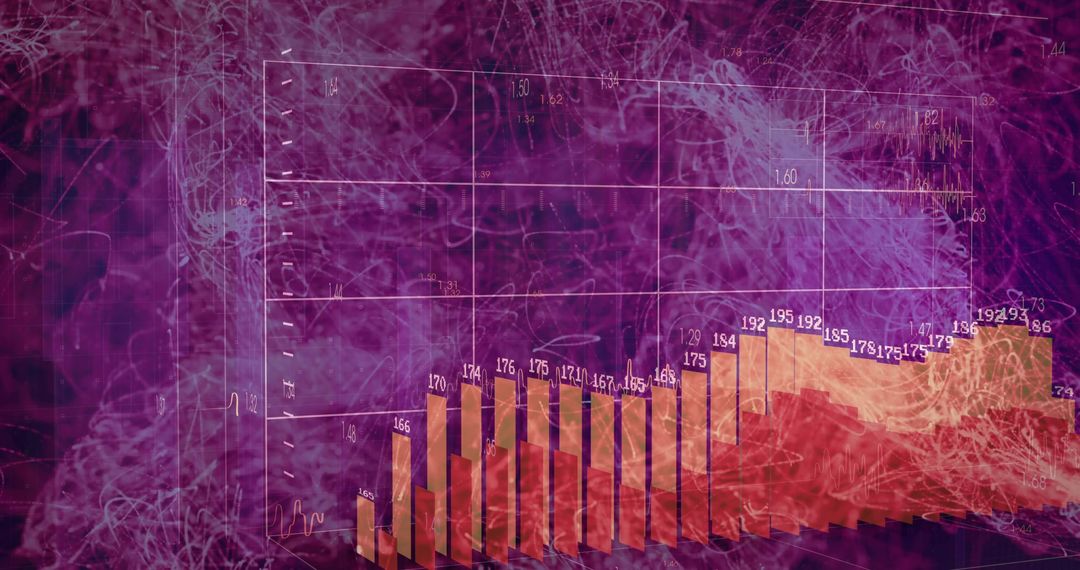
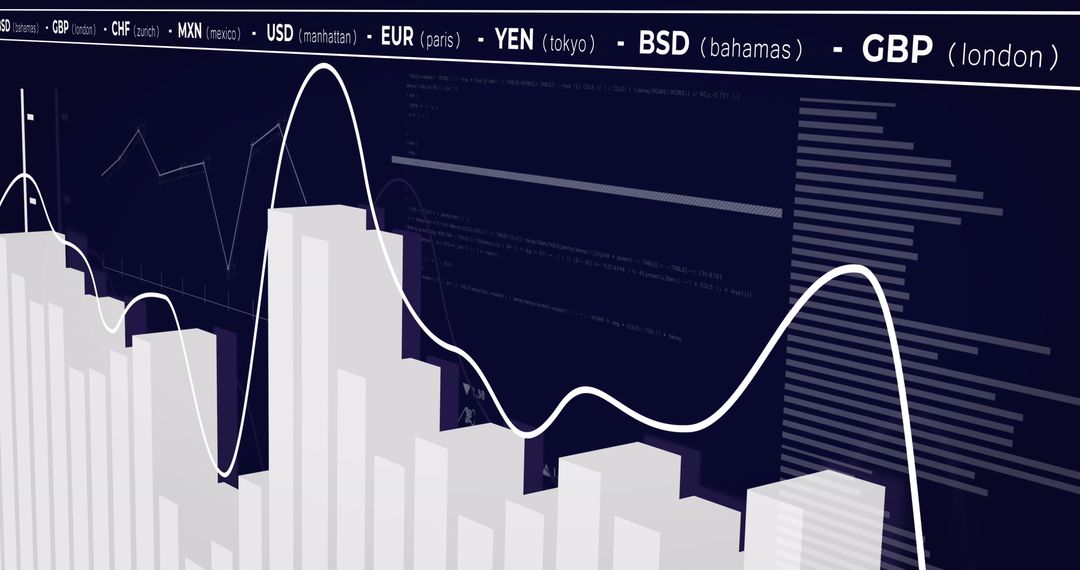
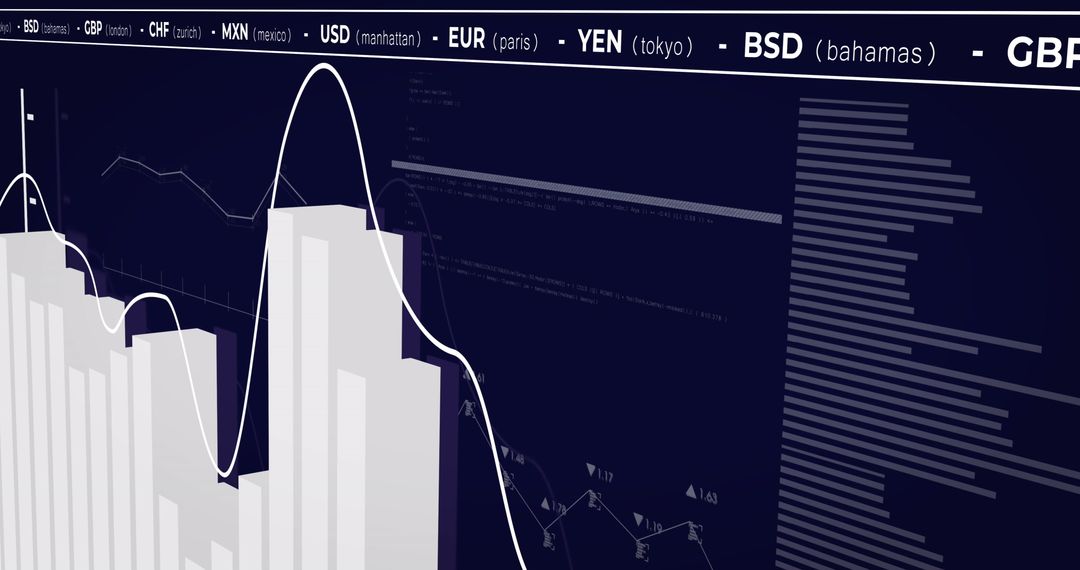
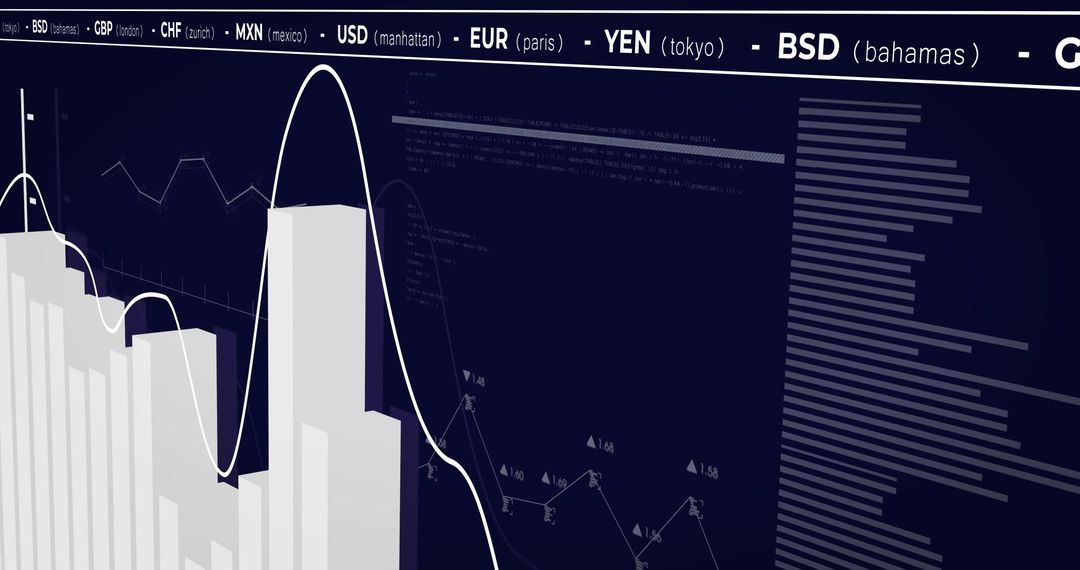
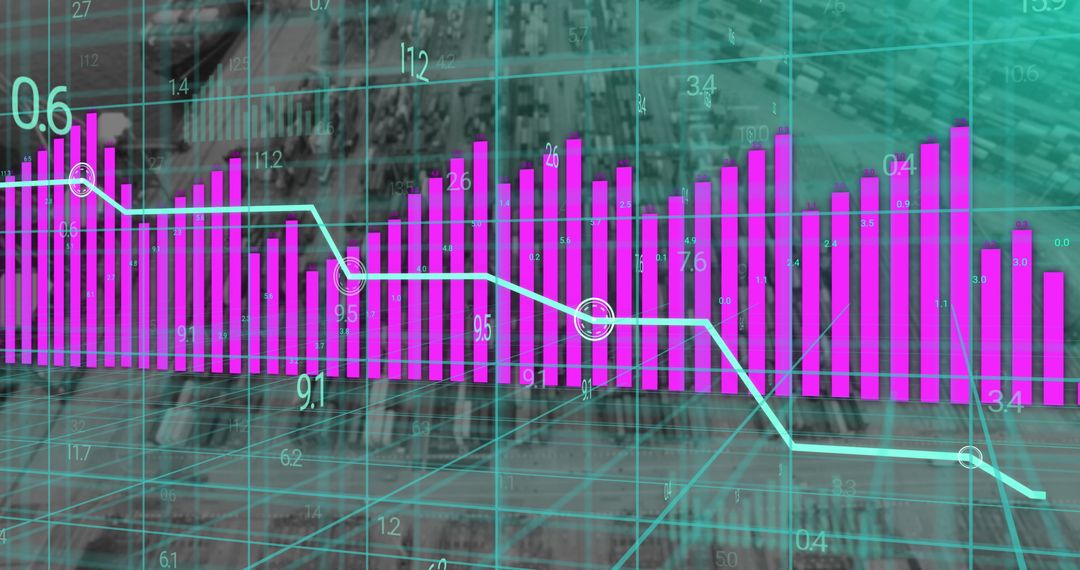
- Graph with Data Background Highlighting Market Trends
Graph with Data Background Highlighting Market Trends Image

Visual representation of market trends through a graph prominently displayed over a backdrop of coded data. Demonstrating concepts in financial analysis or statistical reporting, this is ideal for business presentations, financial projections content, or educational materials aiming to emphasize global business analytics.
Powered by 


0
downloads
downloads
Tags:
More
Credit Photo
If you would like to credit the Photo, here are some ways you can do so
Text Link
photo Link
<span class="text-link">
<span>
<a target="_blank" href=https://pikwizard.com/photo/graph-with-data-background-highlighting-market-trends/690e4d7bd54e17c56db6a364334d2970/>PikWizard</a>
</span>
</span>
<span class="image-link">
<span
style="margin: 0 0 20px 0; display: inline-block; vertical-align: middle; width: 100%;"
>
<a
target="_blank"
href="https://pikwizard.com/photo/graph-with-data-background-highlighting-market-trends/690e4d7bd54e17c56db6a364334d2970/"
style="text-decoration: none; font-size: 10px; margin: 0;"
>
<img src="https://pikwizard.com/pw/medium/690e4d7bd54e17c56db6a364334d2970.jpg" style="margin: 0; width: 100%;" alt="" />
<p style="font-size: 12px; margin: 0;">PikWizard</p>
</a>
</span>
</span>
Free (free of charge)
Free for personal and commercial use.
Author: Authentic Images
Similar Free Stock Images

Premium


Premium


Premium


Premium


Premium


Premium


Premium


Premium


Premium


Premium


Premium


Premium


Premium


Premium


Premium


Premium


Premium


Premium


Premium


Premium


Premium


Premium


Premium


Premium