- Home >
- Stock Photos >
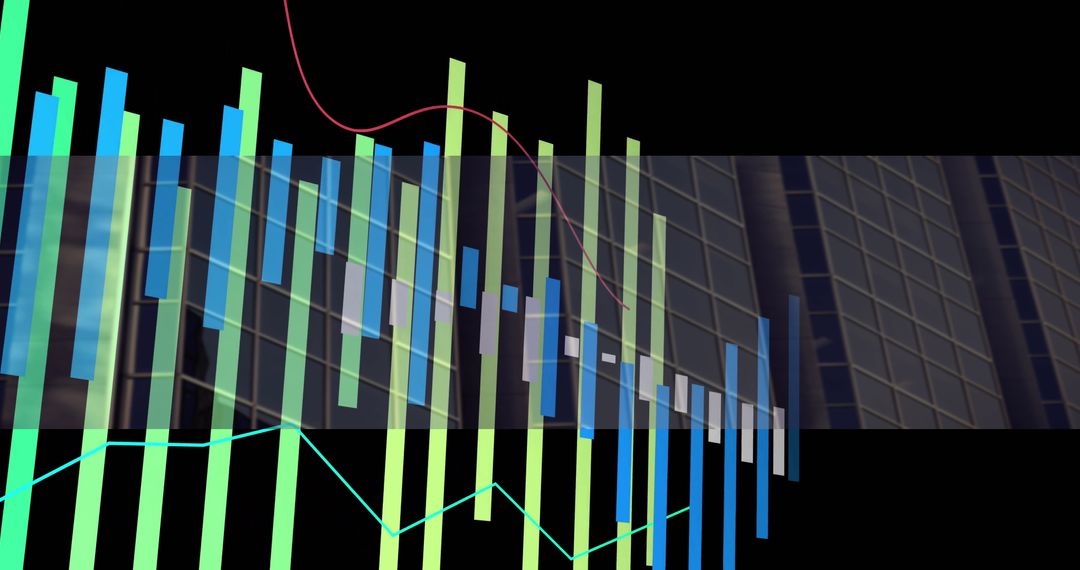
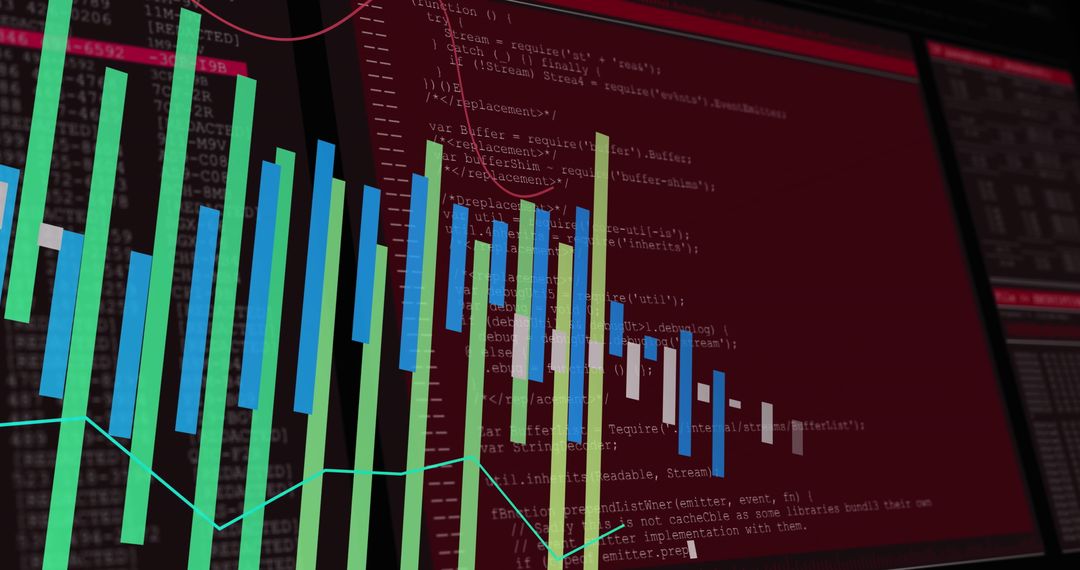
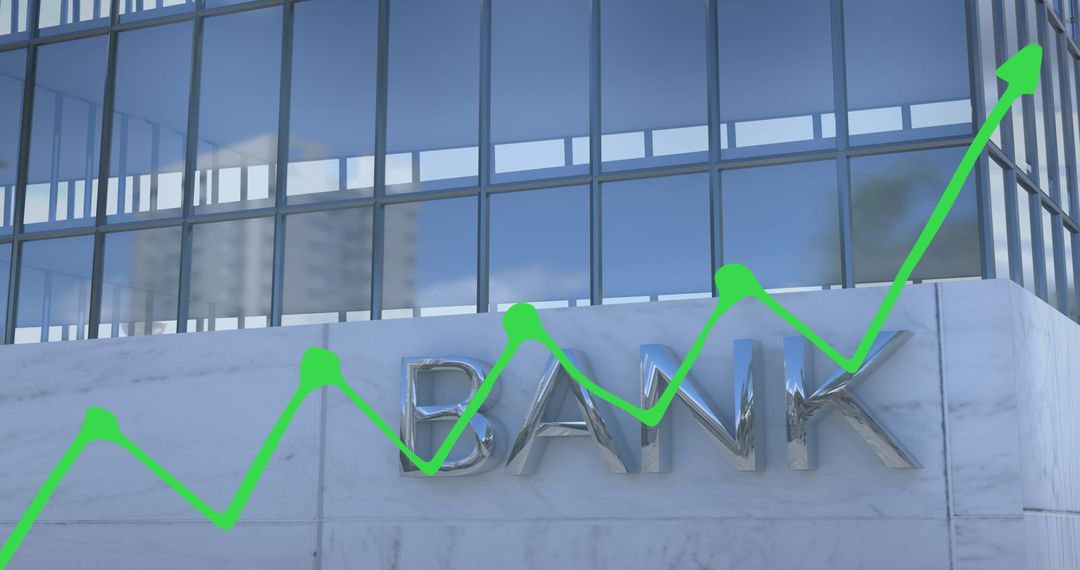
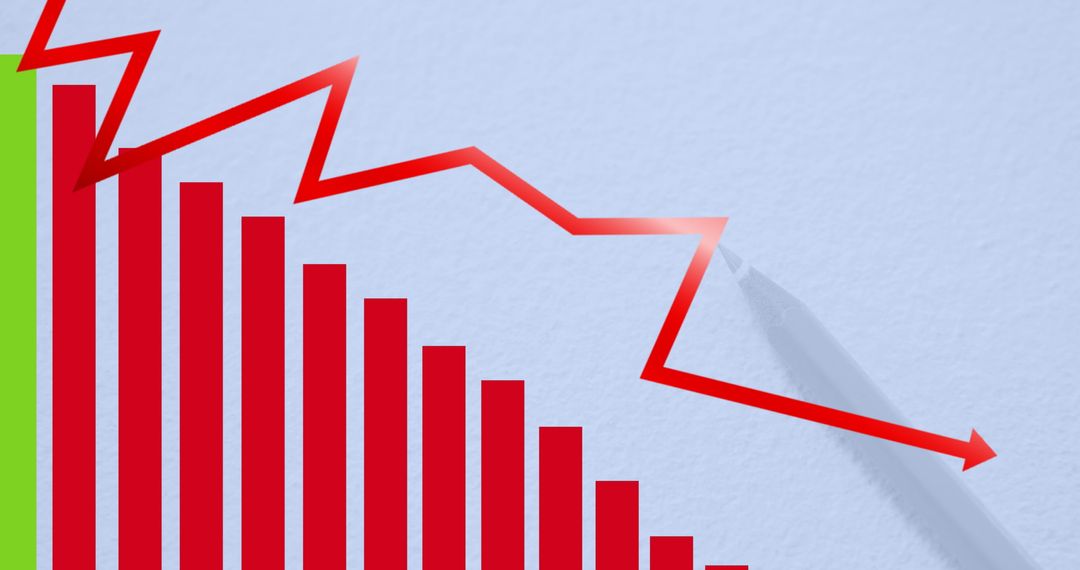
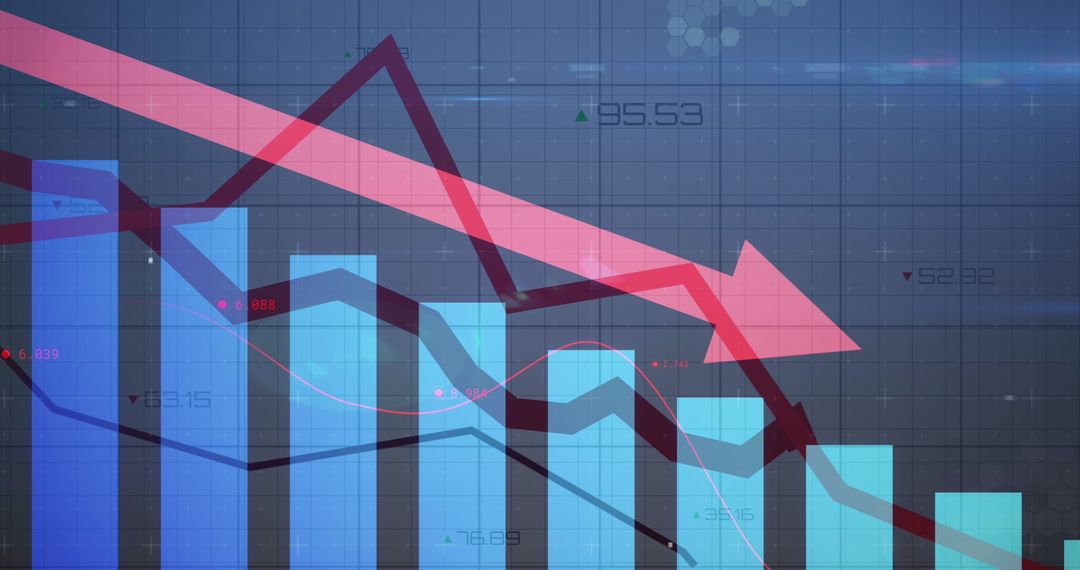
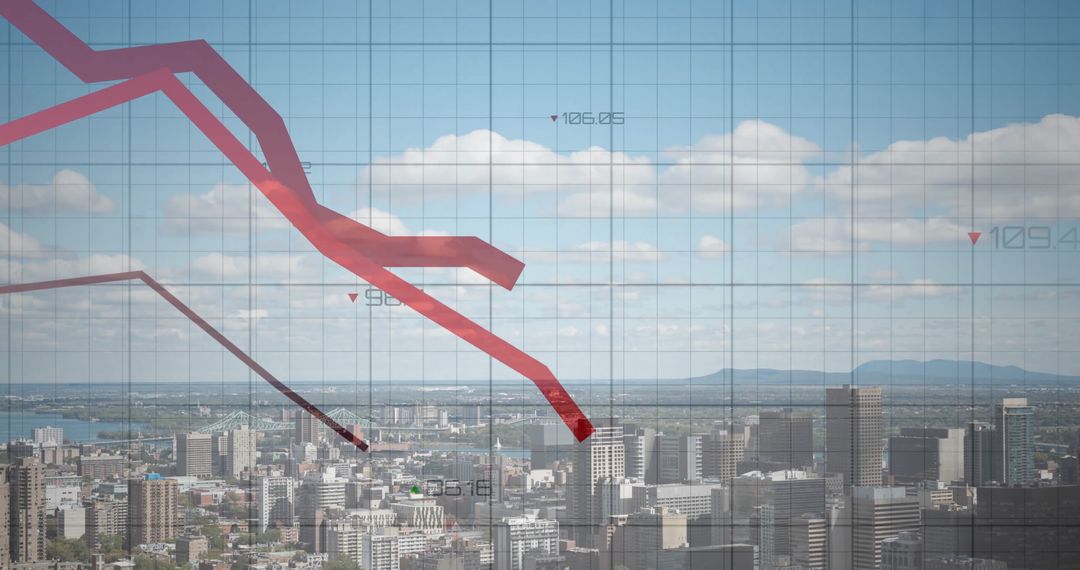
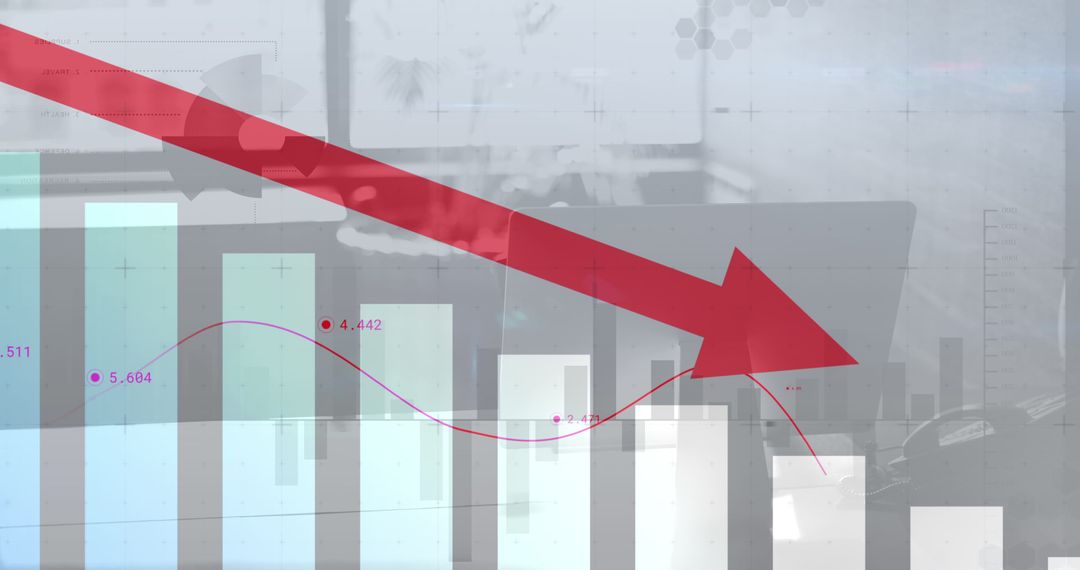
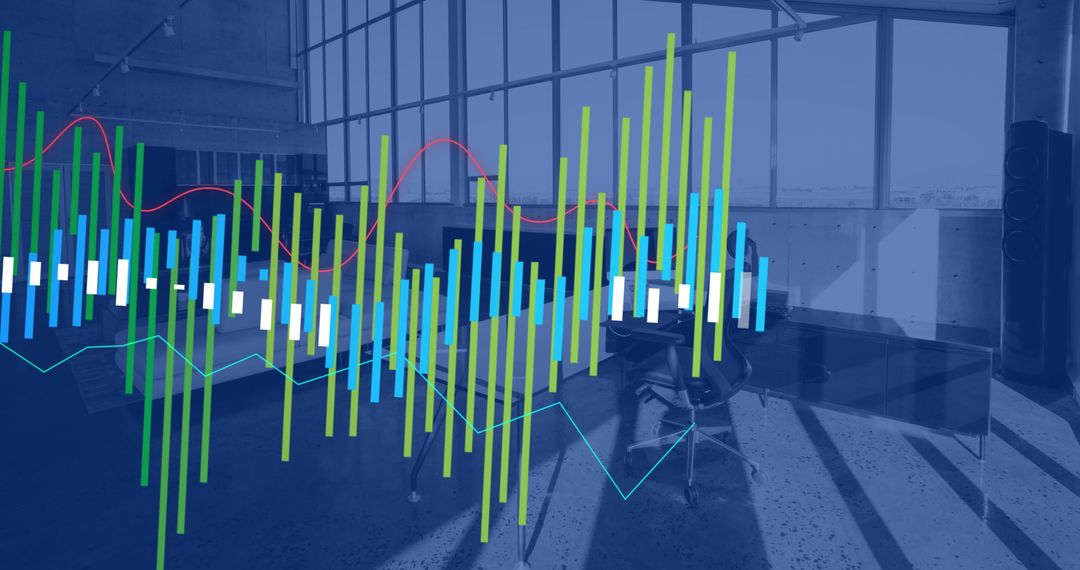
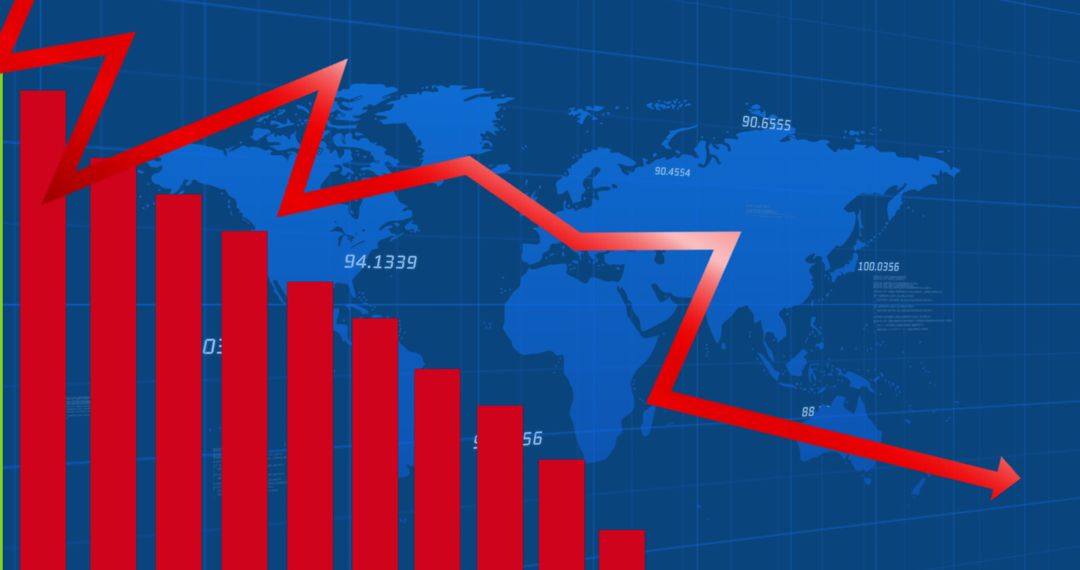
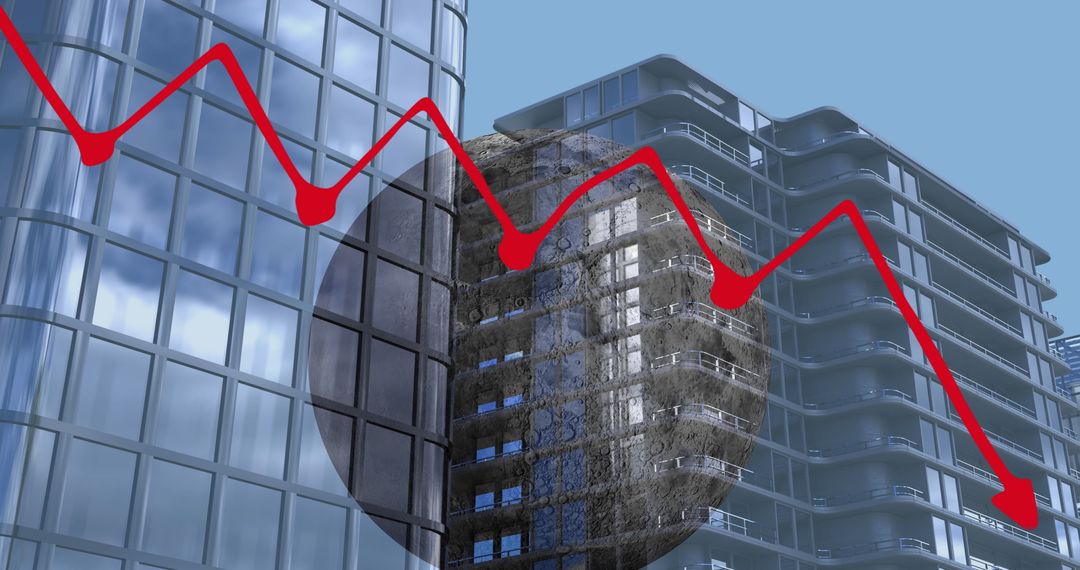
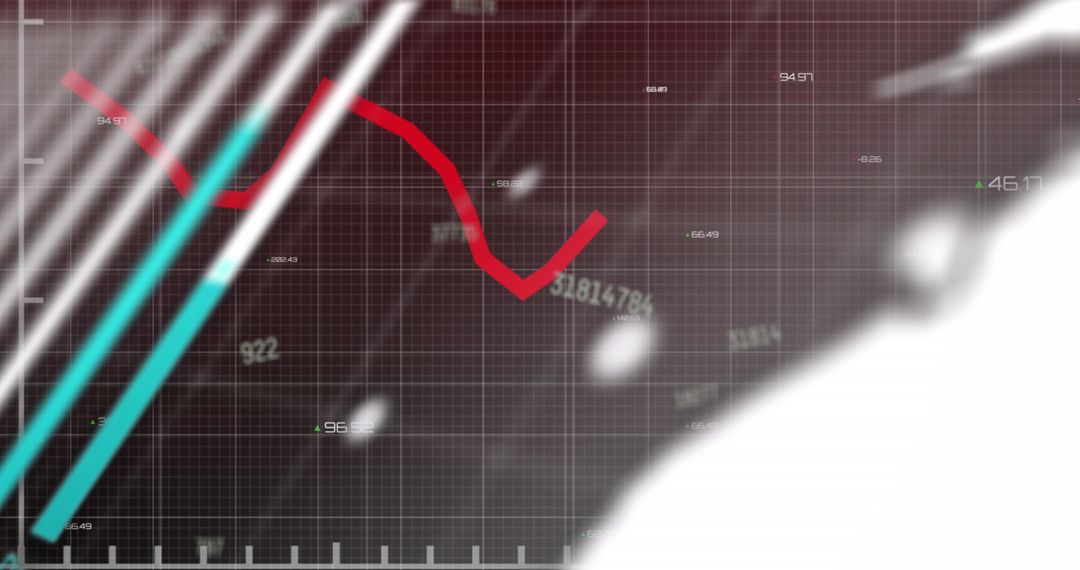
- Graph with Declining Trend on Modern Glass Building Background
Graph with Declining Trend on Modern Glass Building Background Image
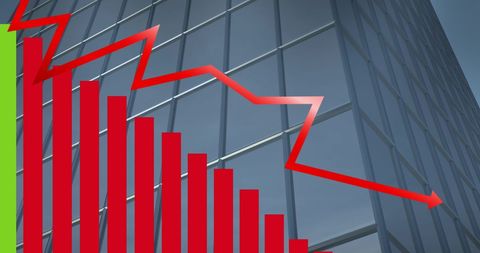
Contrasts a vivid red declining graph with a modern glass building backdrop, this depiction emphasizes economic downturn or financial difficulty. Perfect visual for articles, presentations, or reports on financial analysis, business challenges, economic trends, crisis management, and data-driven decision making in corporate finance.
Powered by 


2
downloads
downloads
Tags:
More
Credit Photo
If you would like to credit the Photo, here are some ways you can do so
Text Link
photo Link
<span class="text-link">
<span>
<a target="_blank" href=https://pikwizard.com/photo/graph-with-declining-trend-on-modern-glass-building-background/d60483a9d3ef083cd873cd188b42dd37/>PikWizard</a>
</span>
</span>
<span class="image-link">
<span
style="margin: 0 0 20px 0; display: inline-block; vertical-align: middle; width: 100%;"
>
<a
target="_blank"
href="https://pikwizard.com/photo/graph-with-declining-trend-on-modern-glass-building-background/d60483a9d3ef083cd873cd188b42dd37/"
style="text-decoration: none; font-size: 10px; margin: 0;"
>
<img src="https://pikwizard.com/pw/medium/d60483a9d3ef083cd873cd188b42dd37.jpg" style="margin: 0; width: 100%;" alt="" />
<p style="font-size: 12px; margin: 0;">PikWizard</p>
</a>
</span>
</span>
Free (free of charge)
Free for personal and commercial use.
Author: People Creations
Similar Free Stock Images
Premium


Premium


Premium


Premium


Premium


Premium


Premium


Premium


Premium


Premium


Premium


Premium


Premium


Premium


Premium


Premium


Premium


Premium


Premium


Premium


Premium


Premium


Premium


Premium