
- Home >
- Stock Photos >
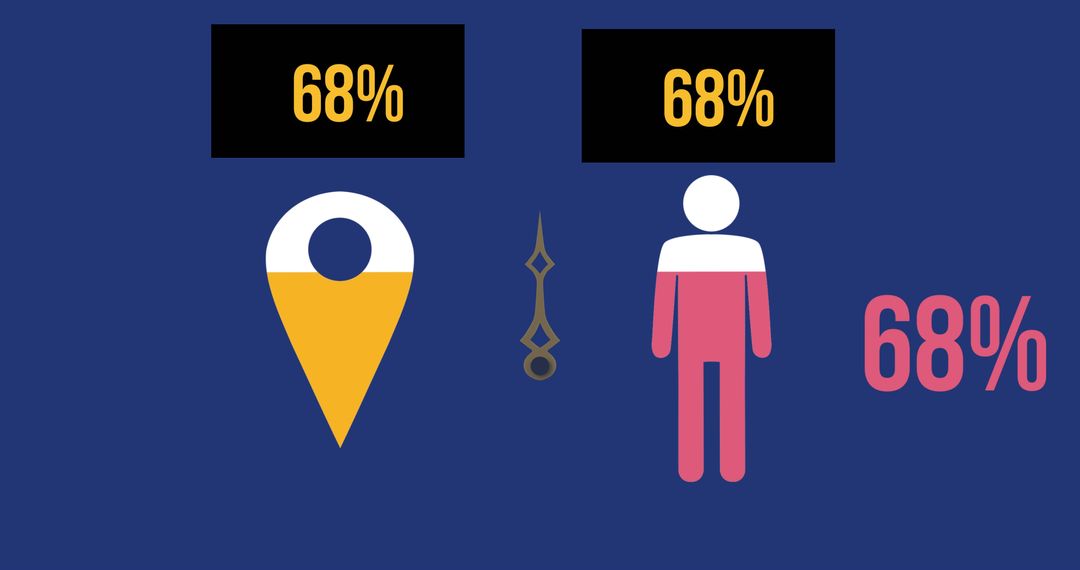
- Graphic Visualization of Statistics with Pie Chart and Figure on Blue
Graphic Visualization of Statistics with Pie Chart and Figure on Blue Image

This visually appealing graphic is ideal for presentations, reports, and educational materials focused on statistics, business analysis, or finance. It leverages simple design to communicate complex ideas clearly, making it a strong choice for a variety of professional and academic contexts. Also useful for digital and print resources aiming to illustrate growth, technology concepts, or data-driven insights.
Powered by  - Get 15% off with code: PIKWIZARD15


2
downloads
downloads
Tags:
More
Credit Photo
If you would like to credit the Photo, here are some ways you can do so
Text Link
photo Link
<span class="text-link">
<span>
<a target="_blank" href=https://pikwizard.com/photo/graphic-visualization-of-statistics-with-pie-chart-and-figure-on-blue/94b254e846a43c28f0d32e568f4364e3/>PikWizard</a>
</span>
</span>
<span class="image-link">
<span
style="margin: 0 0 20px 0; display: inline-block; vertical-align: middle; width: 100%;"
>
<a
target="_blank"
href="https://pikwizard.com/photo/graphic-visualization-of-statistics-with-pie-chart-and-figure-on-blue/94b254e846a43c28f0d32e568f4364e3/"
style="text-decoration: none; font-size: 10px; margin: 0;"
>
<img src="https://pikwizard.com/pw/medium/94b254e846a43c28f0d32e568f4364e3.jpg" style="margin: 0; width: 100%;" alt="" />
<p style="font-size: 12px; margin: 0;">PikWizard</p>
</a>
</span>
</span>
Free (free of charge)
Free for personal and commercial use.
Author: Awesome Content
Similar Free Stock Images

Premium


Premium


Premium


Premium


Premium


Premium


Premium


Premium


Premium


Premium


Premium


Premium


Premium


Premium


Premium


Premium


Premium


Premium


Premium


Premium


Premium


Premium


Premium


Premium

