- Home >
- Stock Photos >
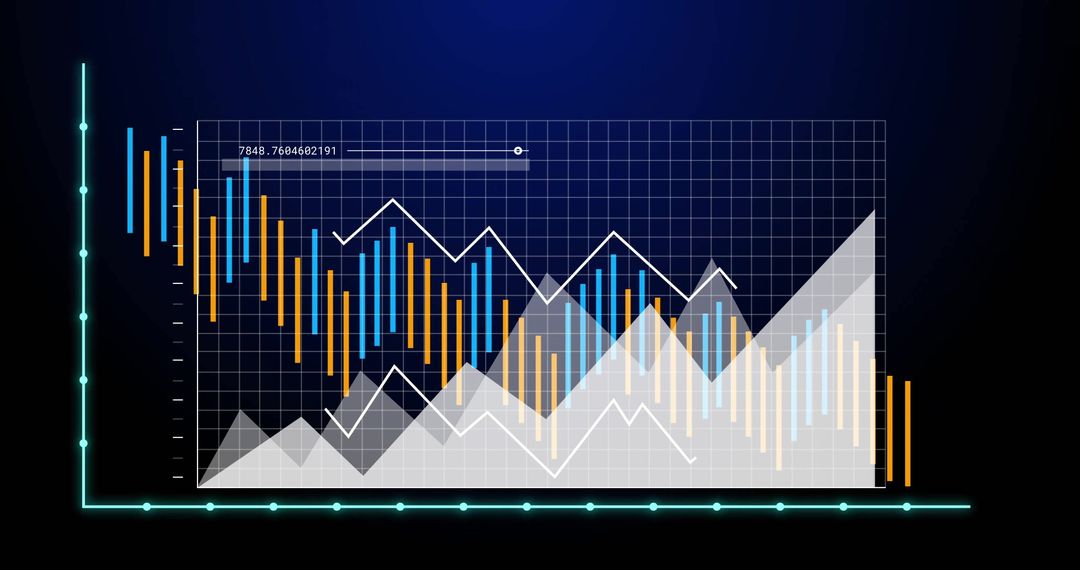
- Graphical Analysis on Russian Economy with Financial Metrics
Graphical Analysis on Russian Economy with Financial Metrics Image

The visual combines elements of financial data trends with the flag of Russia, indicating economic analysis in the context of international politics and the Ukraine crisis. This could be useful for news articles, economic forecasts, political analysis, or educational content on global market impacts.
Powered by  - Get 15% off with code: PIKWIZARD15


2
downloads
downloads
Tags:
More
Credit Photo
If you would like to credit the Photo, here are some ways you can do so
Text Link
photo Link
<span class="text-link">
<span>
<a target="_blank" href=https://pikwizard.com/photo/graphical-analysis-on-russian-economy-with-financial-metrics/b39bbd24a51a3cad290a01430a698b6e/>PikWizard</a>
</span>
</span>
<span class="image-link">
<span
style="margin: 0 0 20px 0; display: inline-block; vertical-align: middle; width: 100%;"
>
<a
target="_blank"
href="https://pikwizard.com/photo/graphical-analysis-on-russian-economy-with-financial-metrics/b39bbd24a51a3cad290a01430a698b6e/"
style="text-decoration: none; font-size: 10px; margin: 0;"
>
<img src="https://pikwizard.com/pw/medium/b39bbd24a51a3cad290a01430a698b6e.jpg" style="margin: 0; width: 100%;" alt="" />
<p style="font-size: 12px; margin: 0;">PikWizard</p>
</a>
</span>
</span>
Free (free of charge)
Free for personal and commercial use.
Author: Creative Art
Similar Free Stock Images
Premium


Premium


Premium


Premium


Premium


Premium