
- Home >
- Stock Photos >
- Graphical Data with Downtime Curve on Digital Interface
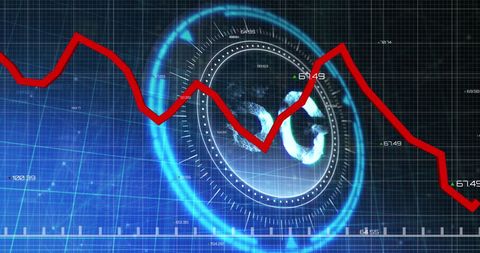
Graphical Data with Downtime Curve on Digital Interface Image
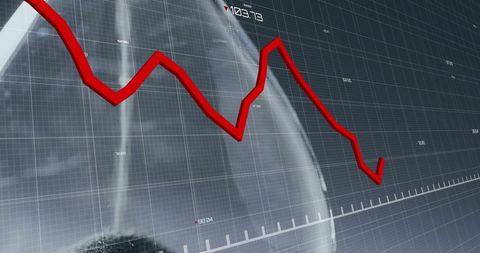
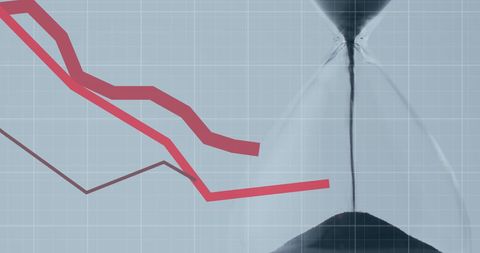
Features a red downturn graph against a digital interface background entwined with an hourglass silhouette. Represents concepts of data analysis, financial downturns, or economic fluctuations. Useful for illustrating reports on economic trends, digital business transformations, and data analysis reports.

downloads
Tags:
More
Credit Photo
If you would like to credit the Photo, here are some ways you can do so
Text Link
photo Link
<span class="text-link">
<span>
<a target="_blank" href=https://pikwizard.com/photo/graphical-data-with-downtime-curve-on-digital-interface/95827db4620d9545a6723b381396ac9b/>PikWizard</a>
</span>
</span>
<span class="image-link">
<span
style="margin: 0 0 20px 0; display: inline-block; vertical-align: middle; width: 100%;"
>
<a
target="_blank"
href="https://pikwizard.com/photo/graphical-data-with-downtime-curve-on-digital-interface/95827db4620d9545a6723b381396ac9b/"
style="text-decoration: none; font-size: 10px; margin: 0;"
>
<img src="https://pikwizard.com/pw/medium/95827db4620d9545a6723b381396ac9b.jpg" style="margin: 0; width: 100%;" alt="" />
<p style="font-size: 12px; margin: 0;">PikWizard</p>
</a>
</span>
</span>
Free (free of charge)
Free for personal and commercial use.
Author: People Creations
Similar Free Stock Images

AI


AI


AI


AI

AI


Explore More Free Stock Images