
- Home >
- Stock Photos >
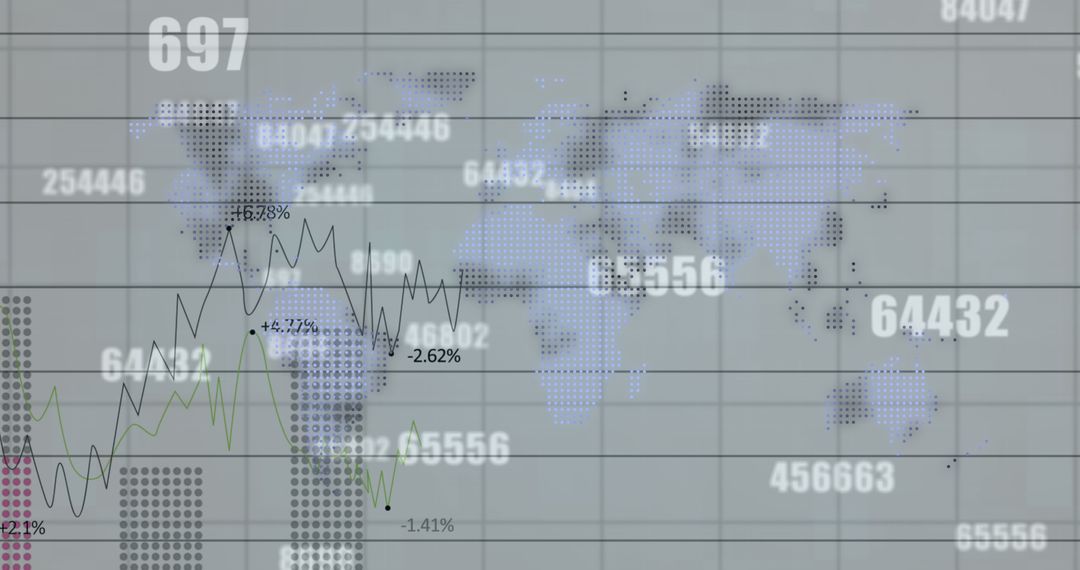
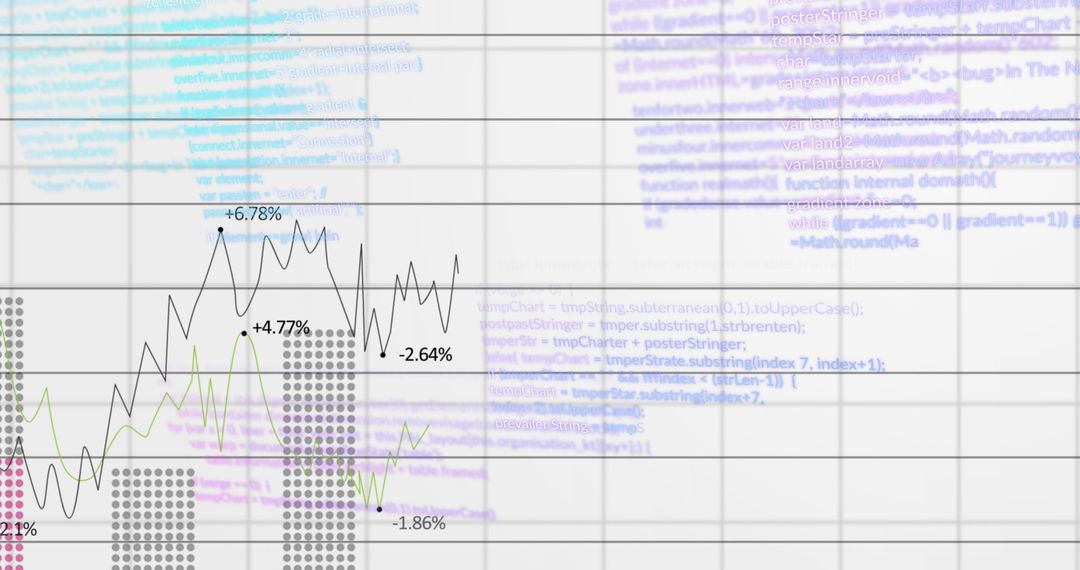
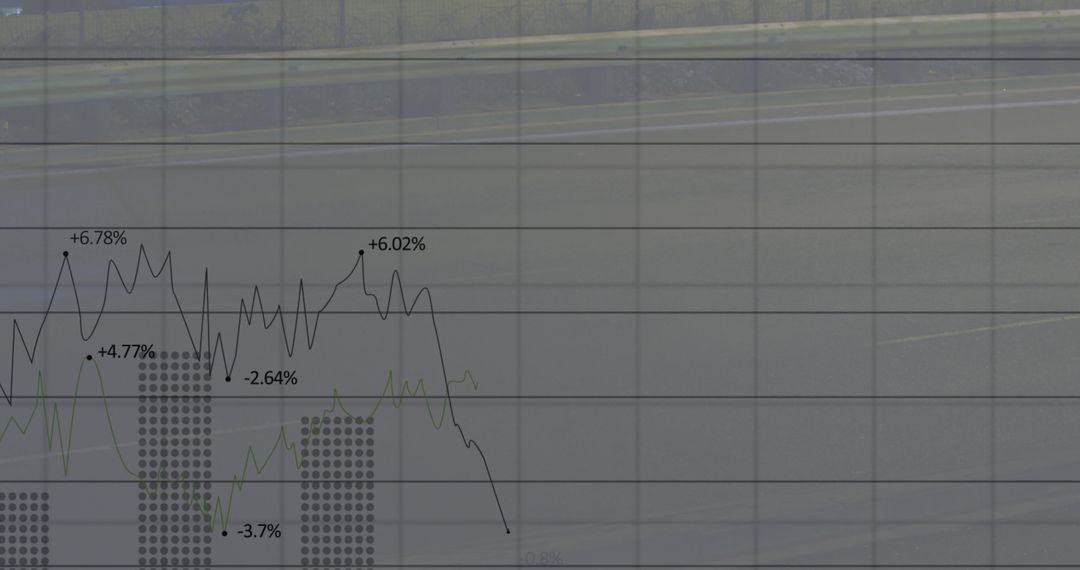
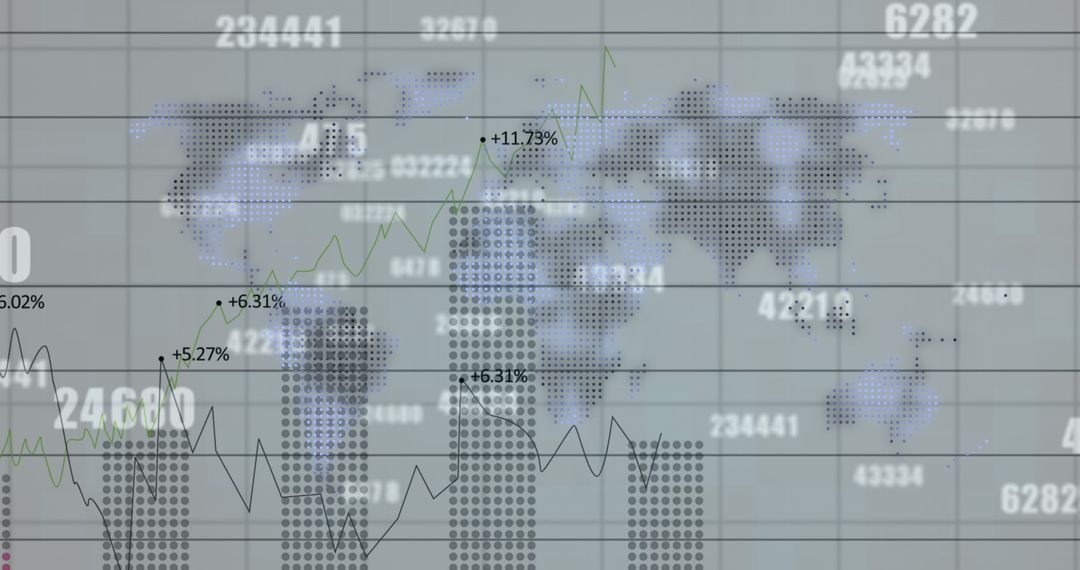
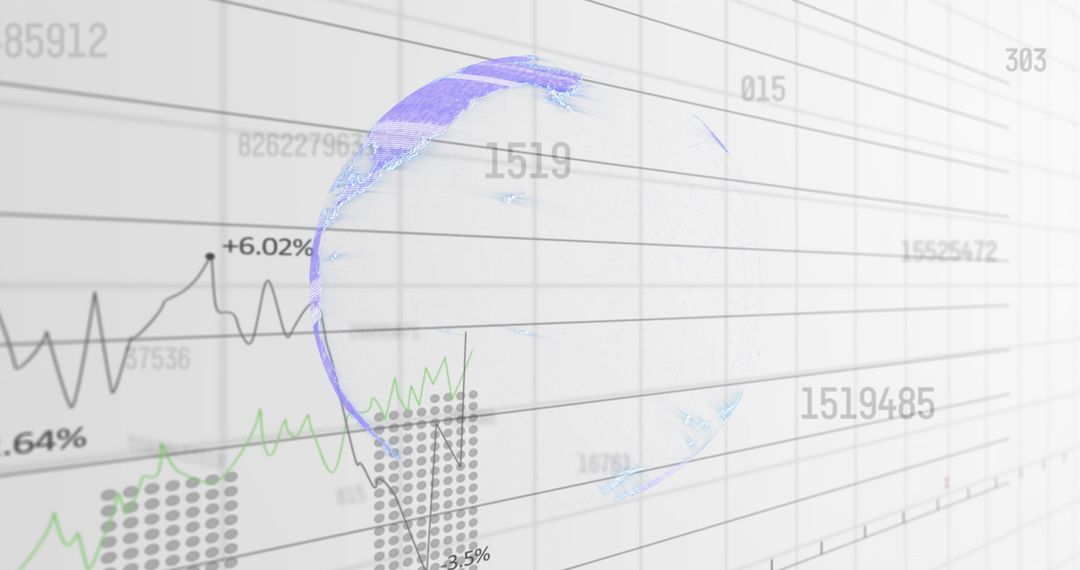
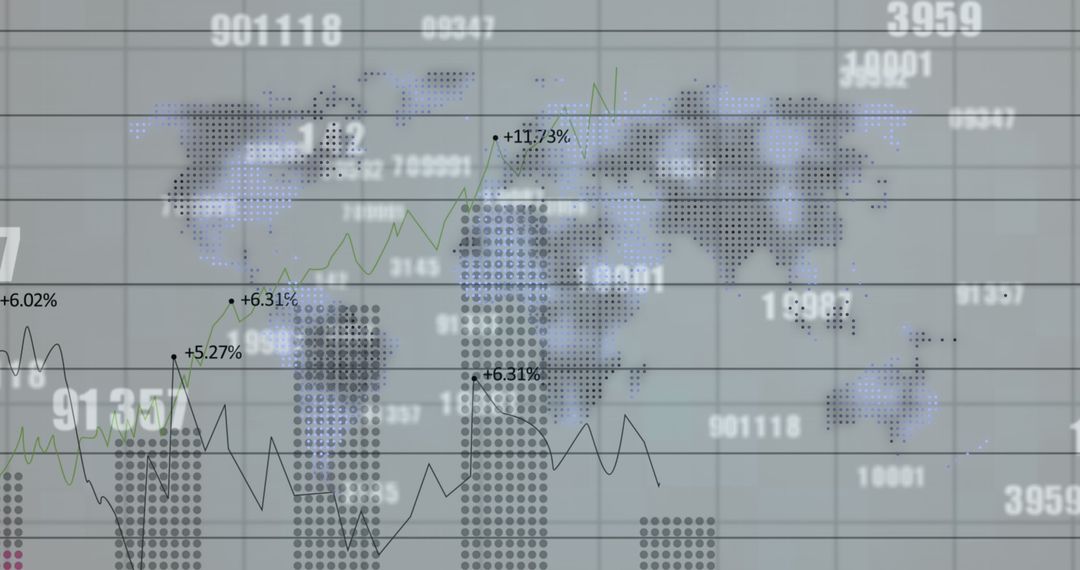
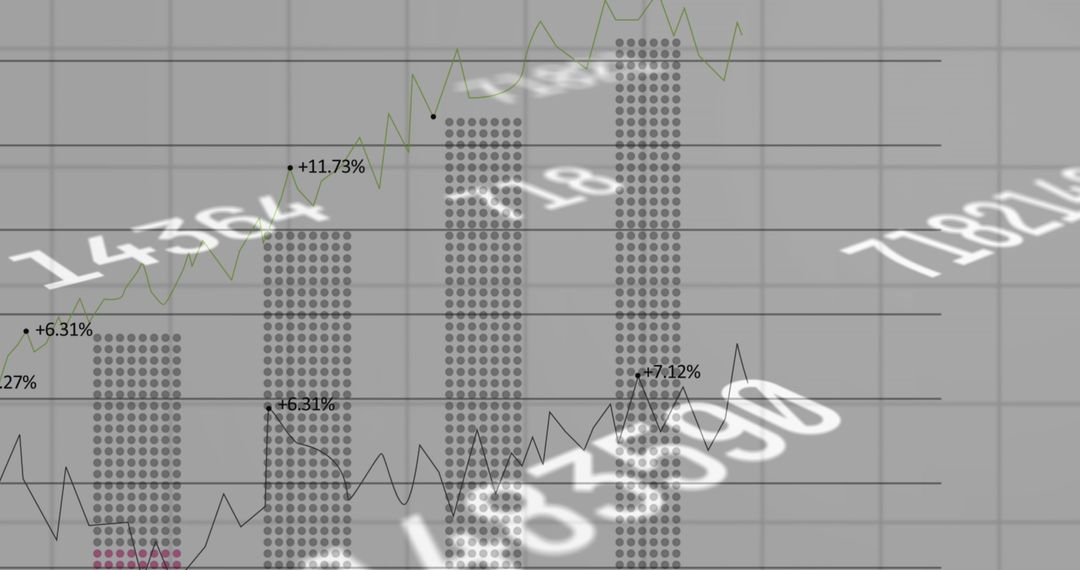
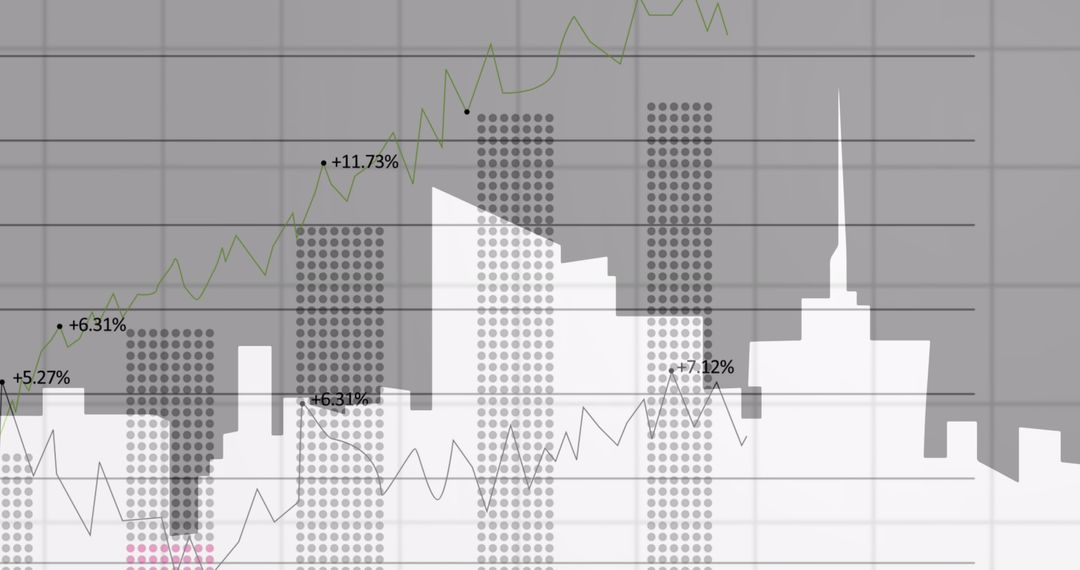
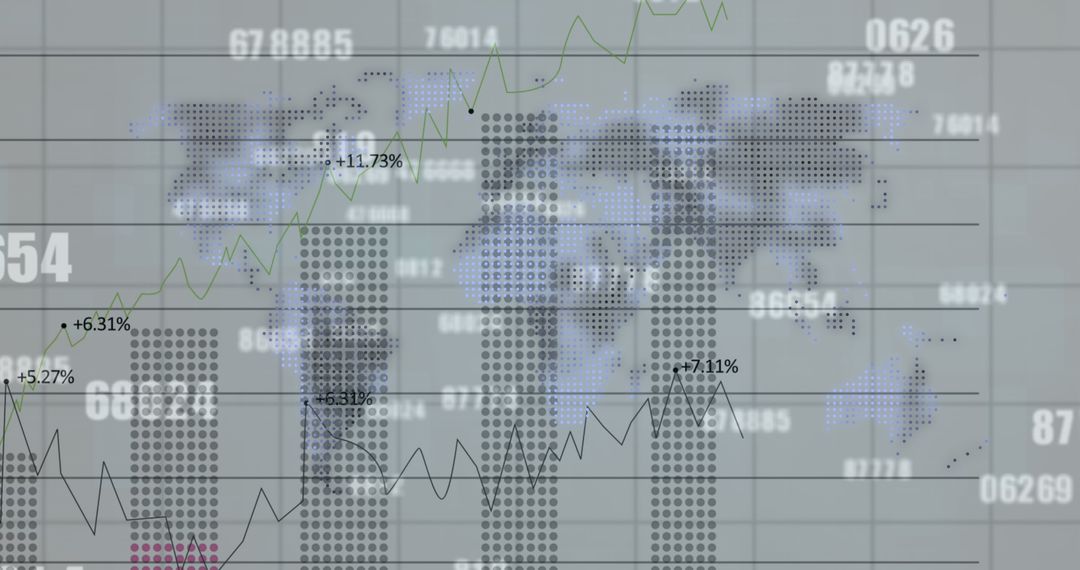
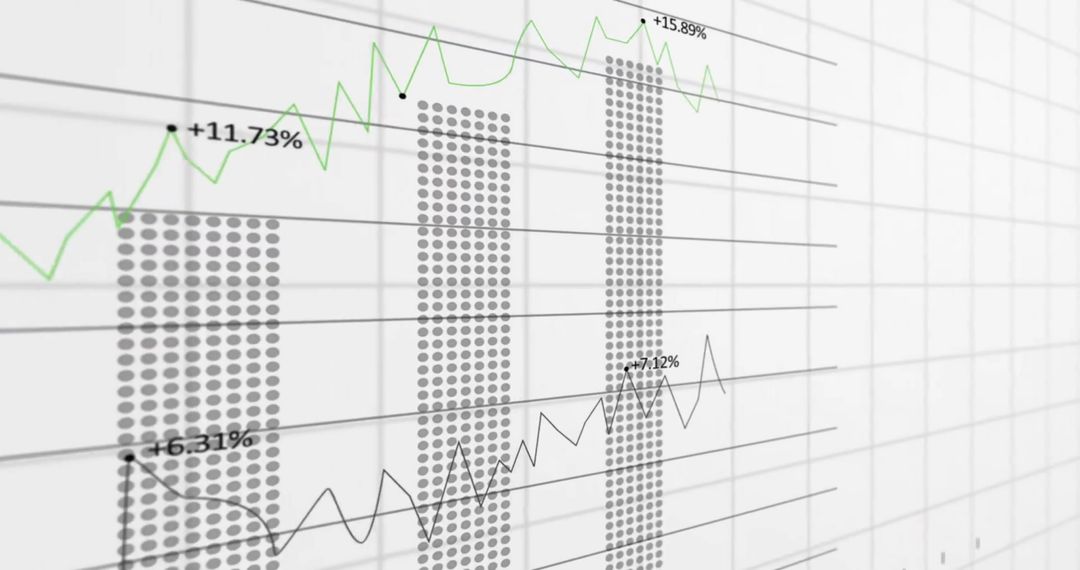
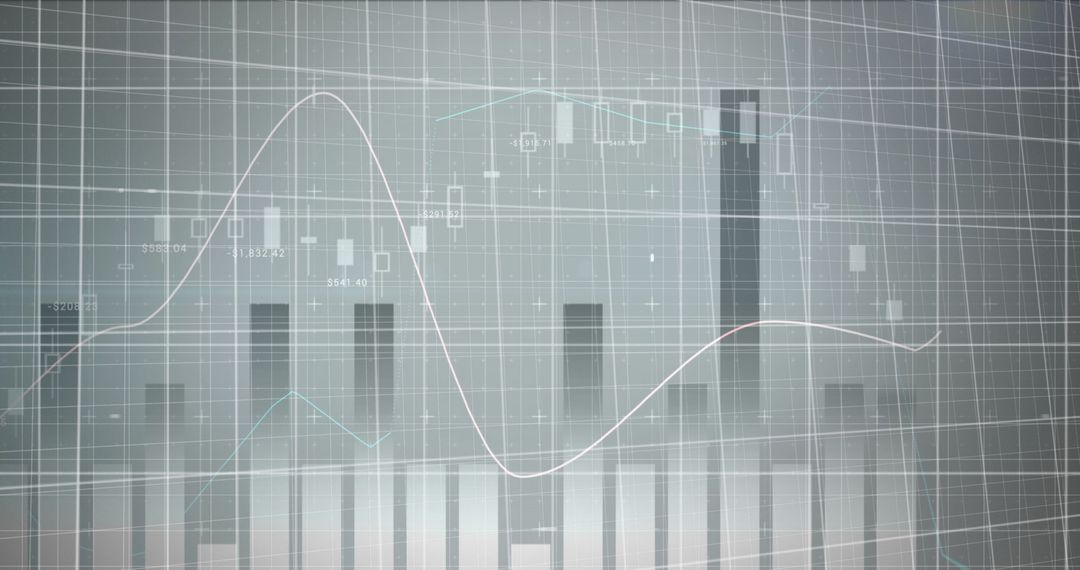
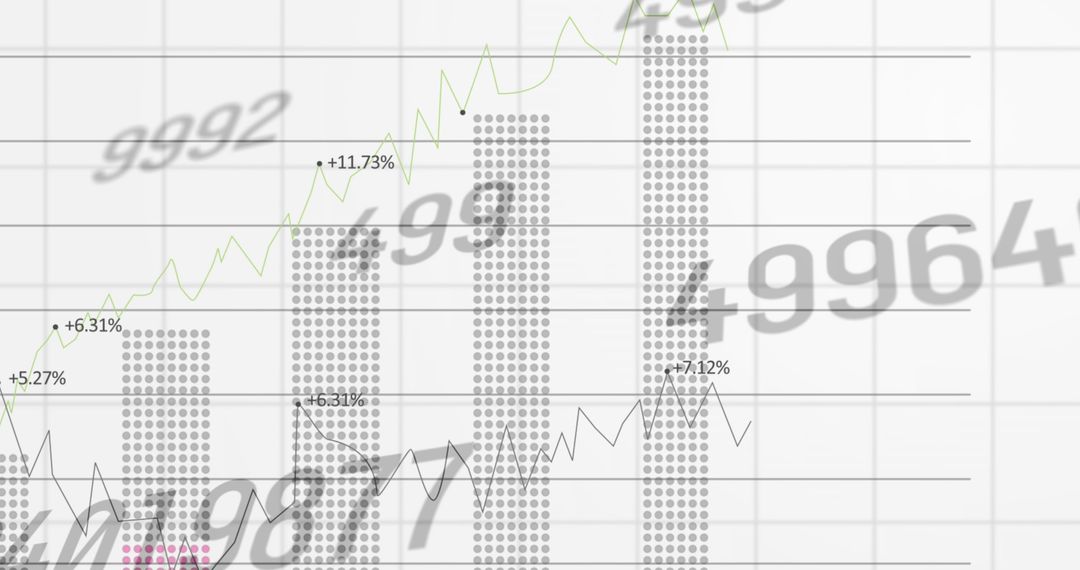
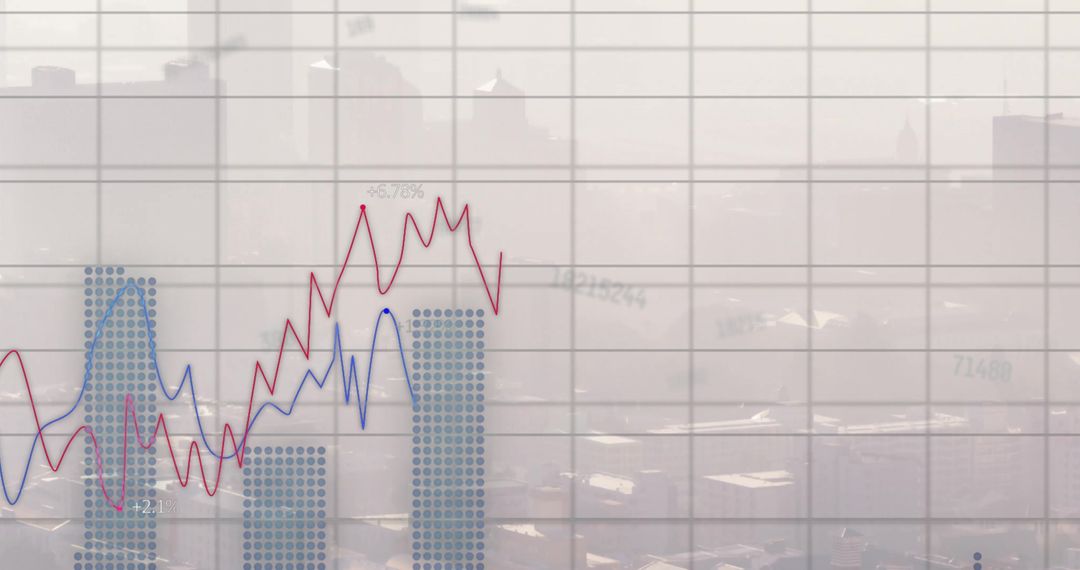
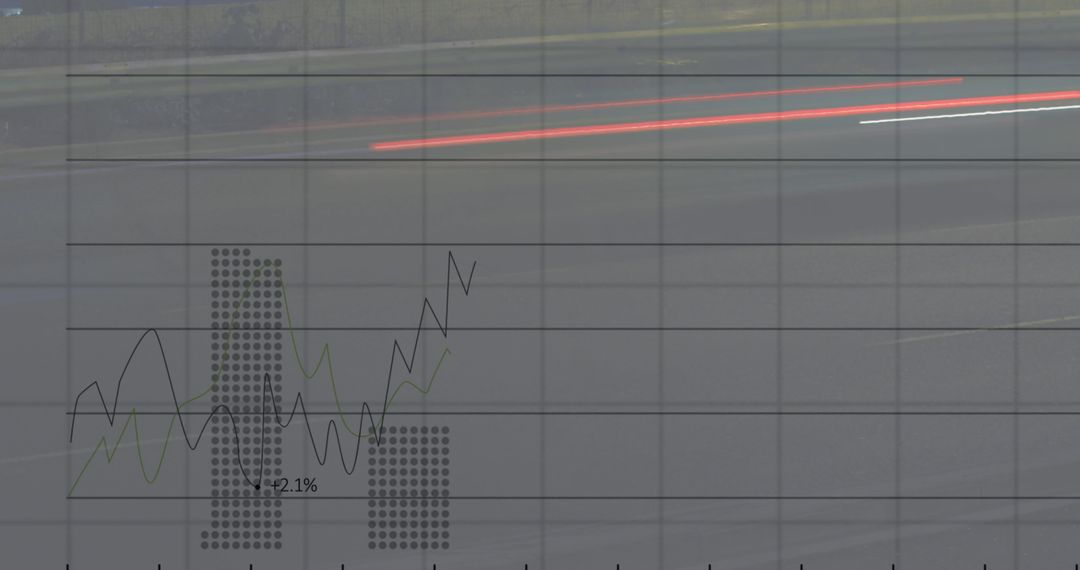
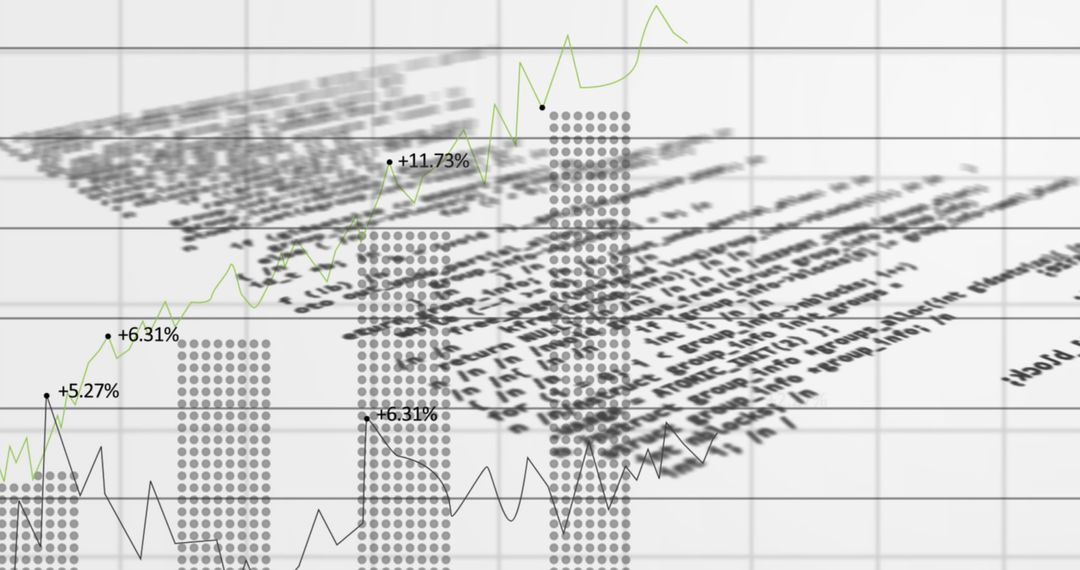
- Grayscale dotted bar chart showing green and black trend lines and percentage labels
Grayscale dotted bar chart showing green and black trend lines and percentage labels Image
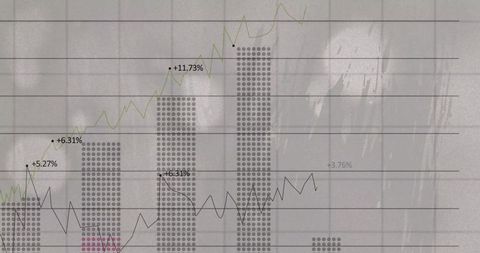
Featuring grayscale dotted bars with green ascending trend line and black fluctuating line with percentage callouts (+5.27%, +6.31%, +11.73%, +3.76%). Clean grid background and subtle texture creating modern, minimal look for data stories. Ideal for business presentations, financial reports, website hero banners, blog articles, social media posts, marketing materials, and infographic layouts. Allowing editors to recolor lines, adjust opacity, and add branding or KPI overlays to match company style. Crop for header or use full bleed for report cover; combine with bold headline and numeric callouts for high-impact visuals.
Powered by  - Get 15% off with code: PIKWIZARD15


0
downloads
downloads
Tags:
More
Credit Photo
If you would like to credit the Photo, here are some ways you can do so
Text Link
photo Link
<span class="text-link">
<span>
<a target="_blank" href=https://pikwizard.com/photo/grayscale-dotted-bar-chart-showing-green-and-black-trend-lines-and-percentage-labels/6302a68136a2971bfe3de534bd42e93c/>PikWizard</a>
</span>
</span>
<span class="image-link">
<span
style="margin: 0 0 20px 0; display: inline-block; vertical-align: middle; width: 100%;"
>
<a
target="_blank"
href="https://pikwizard.com/photo/grayscale-dotted-bar-chart-showing-green-and-black-trend-lines-and-percentage-labels/6302a68136a2971bfe3de534bd42e93c/"
style="text-decoration: none; font-size: 10px; margin: 0;"
>
<img src="https://pikwizard.com/pw/medium/6302a68136a2971bfe3de534bd42e93c.jpg" style="margin: 0; width: 100%;" alt="" />
<p style="font-size: 12px; margin: 0;">PikWizard</p>
</a>
</span>
</span>
Free (free of charge)
Free for personal and commercial use.
Author: Authentic Images
Similar Free Stock Images

Premium

Premium


Premium


Premium


Premium

Premium


Premium


Premium


Premium


Premium


Premium


Premium


Premium


Premium


Premium


Premium


Premium


Premium


Premium


Premium

Premium


Premium


Premium


Premium

