
- Home >
- Stock Photos >
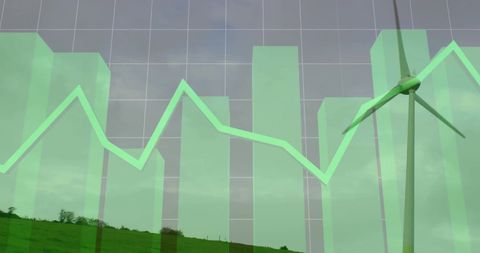
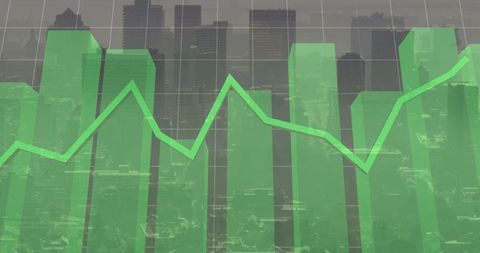
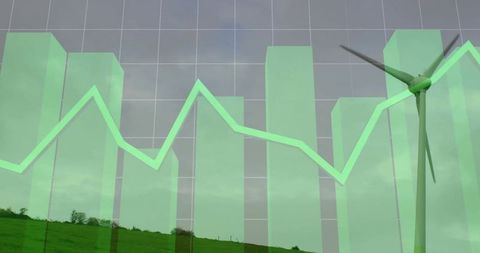
- Green 3D Bar Graph with Line in Digital Analytics Interface
Green 3D Bar Graph with Line in Digital Analytics Interface Image

Perfect for presentations and websites focused on data analytics, business growth, or finance. It illustrates concepts of performance metrics and trend analysis in a clear and modern visual style. Useful for infographics, illustrations about technological themes, or digital advertisement material.
Powered by  - Get 15% off with code: PIKWIZARD15


downloads
Tags:
More
Credit Photo
If you would like to credit the Photo, here are some ways you can do so
Text Link
photo Link
<span class="text-link">
<span>
<a target="_blank" href=https://pikwizard.com/photo/green-3d-bar-graph-with-line-in-digital-analytics-interface/df7039a6a7b52a8471cb8deb9bd46246/>PikWizard</a>
</span>
</span>
<span class="image-link">
<span
style="margin: 0 0 20px 0; display: inline-block; vertical-align: middle; width: 100%;"
>
<a
target="_blank"
href="https://pikwizard.com/photo/green-3d-bar-graph-with-line-in-digital-analytics-interface/df7039a6a7b52a8471cb8deb9bd46246/"
style="text-decoration: none; font-size: 10px; margin: 0;"
>
<img src="https://pikwizard.com/pw/medium/df7039a6a7b52a8471cb8deb9bd46246.jpg" style="margin: 0; width: 100%;" alt="" />
<p style="font-size: 12px; margin: 0;">PikWizard</p>
</a>
</span>
</span>
Free (free of charge)
Free for personal and commercial use.
Author: Creative Art
Similar Free Stock Images

Premium


Premium


Premium

Premium


Premium


Premium

Premium


Premium


Premium

Premium


Premium


Premium


Premium


Premium


Premium


Premium


Premium


Premium


Premium


Premium


Premium


Premium

Premium


Premium


Premium


Explore More Free Stock Images