- Home >
- Stock Photos >
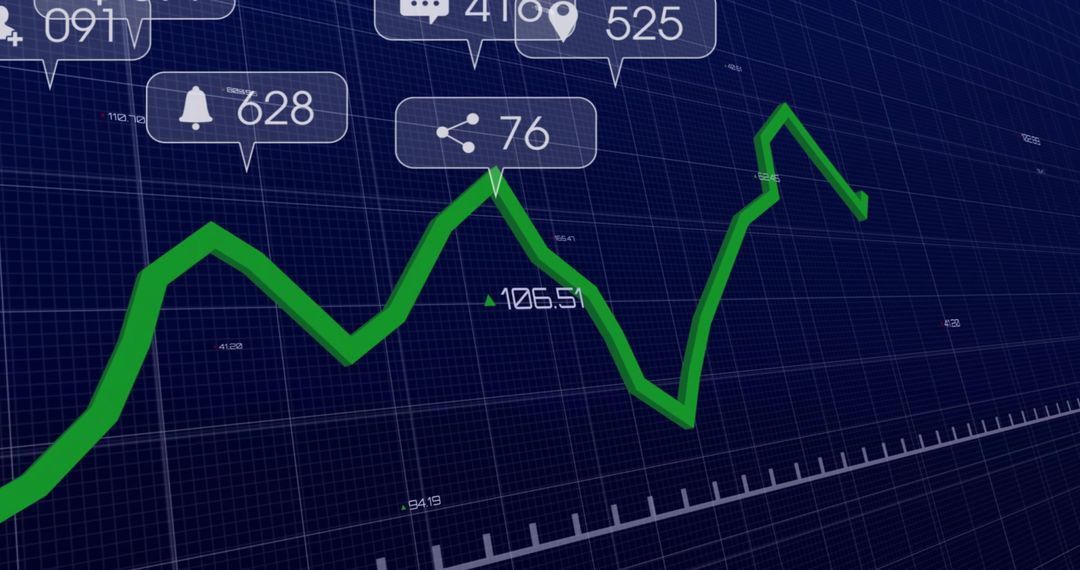
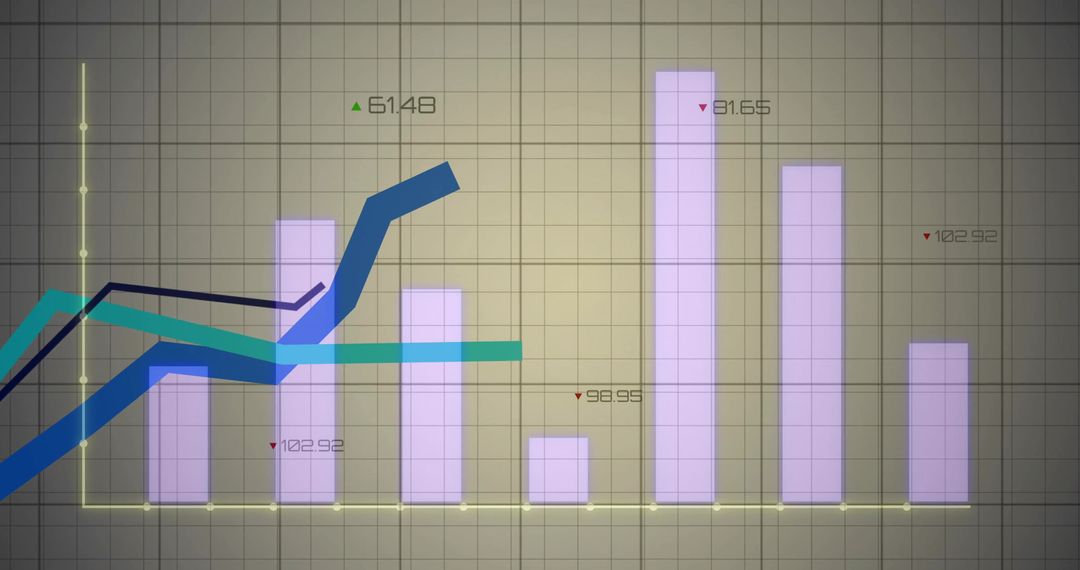
- Green 3D Line Chart Showing Market Growth and Volatility on Dark Financial Dashboard
Green 3D Line Chart Showing Market Growth and Volatility on Dark Financial Dashboard Image

Showing green 3D line rising across dark grid dashboard with translucent gray bars and numeric labels. Conveying market growth, volatility, trend reversal, and performance metrics with high-tech analytical mood. Working well for financial reports, investor presentations, market analysis articles, fintech websites, trading platform UI mockups, and social media campaigns. Allowing overlay of text, headlines, or data callouts for hero banners, blog headers, slide decks, marketing assets, and sales materials.
Powered by  - Get 15% off with code: PIKWIZARD15


0
downloads
downloads
Tags:
More
Credit Photo
If you would like to credit the Photo, here are some ways you can do so
Text Link
photo Link
<span class="text-link">
<span>
<a target="_blank" href=https://pikwizard.com/photo/green-3d-line-chart-showing-market-growth-and-volatility-on-dark-financial-dashboard/2cec6a530d8356ec59c7eba86b7482d7/>PikWizard</a>
</span>
</span>
<span class="image-link">
<span
style="margin: 0 0 20px 0; display: inline-block; vertical-align: middle; width: 100%;"
>
<a
target="_blank"
href="https://pikwizard.com/photo/green-3d-line-chart-showing-market-growth-and-volatility-on-dark-financial-dashboard/2cec6a530d8356ec59c7eba86b7482d7/"
style="text-decoration: none; font-size: 10px; margin: 0;"
>
<img src="https://pikwizard.com/pw/medium/2cec6a530d8356ec59c7eba86b7482d7.jpg" style="margin: 0; width: 100%;" alt="" />
<p style="font-size: 12px; margin: 0;">PikWizard</p>
</a>
</span>
</span>
Free (free of charge)
Free for personal and commercial use.
Author: Awesome Content
Similar Free Stock Images

Premium


Premium


Premium


Premium


Premium


Premium


Premium


Premium


Premium


Premium


Premium


Premium


Premium


Premium


Premium


Premium


Premium


Premium


Premium


Premium


Premium


Premium


Premium


Premium