
- Home >
- Stock Photos >
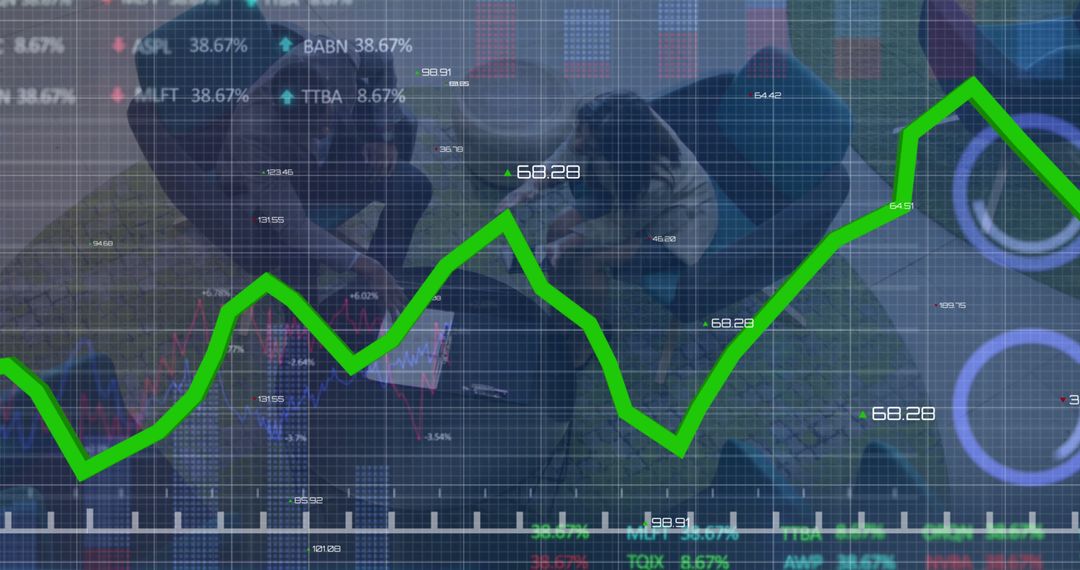
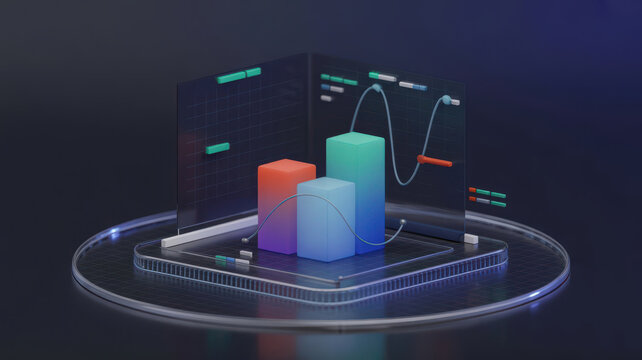
- Green 3D Line Chart Tracking Market Trends on Dark Grid Dashboard Interface Analytics
Green 3D Line Chart Tracking Market Trends on Dark Grid Dashboard Interface Analytics Image

Displaying thick green 3D line chart zigzagging across dark blue grid plane with numeric marker 106.51 and translucent UI bubbles showing notifications and share counts. Serving as visual metaphor for market trends, performance tracking, growth analysis, and finance dashboards. Working well for hero banners, presentation slides, investor reports, fintech websites, app mockups, social media ads, and training materials. Allowing easy overlay of headlines, KPI figures, call-to-action elements, and color adjustments to match brand identity.
Powered by 


0
downloads
downloads
Tags:
More
Credit Photo
If you would like to credit the Photo, here are some ways you can do so
Text Link
photo Link
<span class="text-link">
<span>
<a target="_blank" href=https://pikwizard.com/photo/green-3d-line-chart-tracking-market-trends-on-dark-grid-dashboard-interface-analytics/66128b8a184ea8e9ab1a6a2334738ab1/>PikWizard</a>
</span>
</span>
<span class="image-link">
<span
style="margin: 0 0 20px 0; display: inline-block; vertical-align: middle; width: 100%;"
>
<a
target="_blank"
href="https://pikwizard.com/photo/green-3d-line-chart-tracking-market-trends-on-dark-grid-dashboard-interface-analytics/66128b8a184ea8e9ab1a6a2334738ab1/"
style="text-decoration: none; font-size: 10px; margin: 0;"
>
<img src="https://pikwizard.com/pw/medium/66128b8a184ea8e9ab1a6a2334738ab1.jpg" style="margin: 0; width: 100%;" alt="" />
<p style="font-size: 12px; margin: 0;">PikWizard</p>
</a>
</span>
</span>
Free (free of charge)
Free for personal and commercial use.
Author: Authentic Images
Similar Free Stock Images

Premium


Premium


Premium


Premium


Premium


Premium


Premium


Premium


Premium


Premium


Premium


Premium


Premium


Premium


Premium


Premium


Premium


Premium


Premium


Premium


Premium


Premium


Premium


Premium

