1. Home > 
  2. Stock Photos > 
  3. Green Bar and Line Graph on Abstract Connected Grid Background

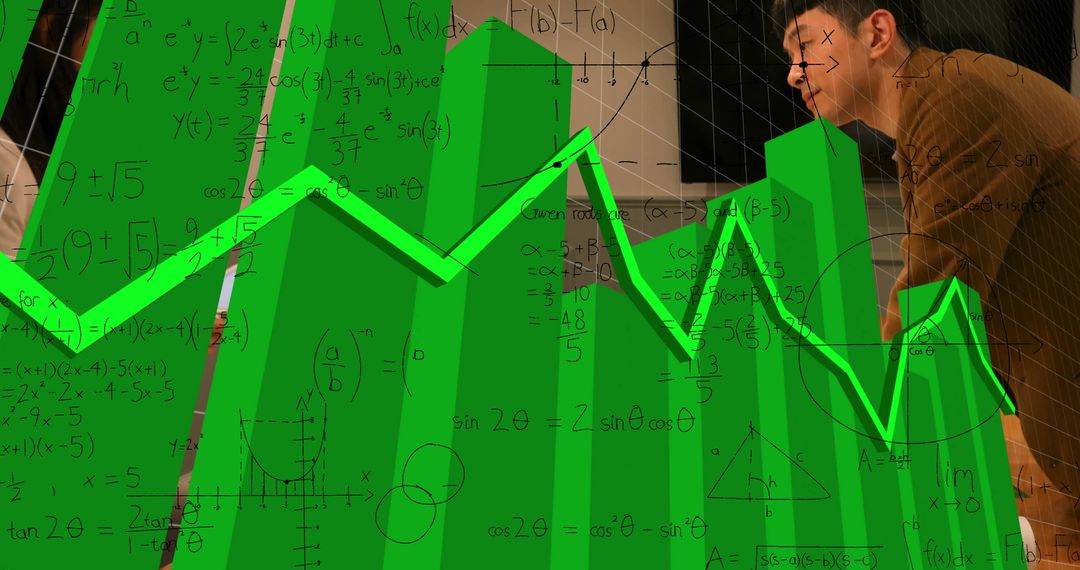
Green Bar and Line Graph on Abstract Connected Grid Background Image

Green Bar and Line Graph on Abstract Connected Grid Background

This image features a 3D green bar chart with a luminous green line graph overlay, set against an abstract grid with connecting nodes. Useful for illustrating concepts of finance, economic growth, data analysis, and global networks in presentations, reports, and graphic designs.

Powered by Adobe logo
Sustainable business growth: glowing bar and line graphs rise from vibrant green grass in a concrete planter, symbolizing financial success and eco-investment. - Powered by AdobeGreen graph line rising on bar chart. Stock market price growth, financial profit success in investment business. - Powered by AdobeGreen bar graph with a line showing upward trend on a black background. - Powered by AdobeChart showing rising green graph - Powered by AdobeVibrant pie chart, bar graph, and line graph drawn in colorful chalk on a dark green chalkboard,  design,  chart - Powered by Adobe

Credit Photo

If you would like to credit the Photo, here are some ways you can do so

Free (free of charge)

Free for personal and commercial use.

Author: People Creations

Similar Free Stock Images

Rising Green Graph with Fluctuating Statistical Line
Premium
A vibrant, futuristic bar graph with an ascending line, illuminated in neon blue and green, showcasing growth and progress against a dark, reflective surface
Data Terminal with Moving Graph Lines over Skyscrapers
Digital Red Line Graph Indicating Financial Trends with Grid Background
Futuristic Financial Data and Communication Interface
Dynamic Financial Data Chart on Digital Network Background
Premium
Dynamic blue and green digital stock market graph with bar charts and lines on a dark background, representing financial data analysis, investment trends, business growth, and global economy fluctuat
Rising Green Market Graph Overlay in Dimly Lit Cityscape
Digital Financial Data Analysis Over Cityscape Background
Green Financial Graph Overlay on Cityscape Indicating Economic Trends
Financial Data Visualized over Urban Cityscape
Premium
Colorful 3D bar chart with an upward-trending line graph, set on a white platform
Data Analysis with Green Graph and Virus Cells Background
Digital Data Processing in Futuristic Cityscape
Visualizing Trends in Financial Data with Code and Graphs
Futuristic Data Analysis with Graphs and Scanner Overlay
Premium
Financial stock market candlestick chart showing green and red bars with various trend lines on a dark blue background
Dynamic Financial Figures and Pattern on Black Background
Dynamic Chart Illustrating Financial Volatility and Trends
Abstract Financial Data Visualization with Declining Graph
Declining Graph Showing Market Trends
Premium
Green graph line rising on bar chart. Stock market price growth, financial profit success in investment business.
Green Growth Line on Abstract Digital Network Background
Fluctuating Financial Data and Statistical Analysis Concept
Green Bar and Line Chart on Black Grid Representing Financial Data
Architect Analyzing Financial Data with Mathematical Technology Overlay
Premium
A white arrow pointing upwards is on a blue background
Red Line Graph Depicting Financial Market Analysis with Bar Chart
Abstract Green Financial Growth Bar Chart
Cybersecurity Dashboard with Data Analytics and Code Interface Visualization
3D Bars and Red Line Graph Overlaid on Blue Grid
Red Graph Depicting Fluctuating Financial Markets
Green Line Graph Over Cityscape Depicting Financial Growth
Premium
hand holding green graph showing positive growth on dark background
Fluctuating Financial Graph with Red Trend Line Display
Dynamic Global Financial Data and Analytics Interface
Financial Growth Chart Overlay on Cityscape
Financial Data Analysis Over Cityscape Graph
Premium
Visual representation of upward financial growth and positive economic trend depicted by a rising bar graph and arrow
Corporate Office Statistics and Finance Analytics
Businesswoman Analyzing Financial Growth Concepts
Financial Data Processing with Green Bar Graph Overlay
Business Data Analytics Technology Concept with Graphs
Premium
Hand holding a glowing 3d bar graph with an upward trending line showing financial growth and success
Abstract Digital Financial Growth Over Cityscape
Green Line Chart with Financial Data on Dark Background
Rising Green Bar Graph and Line Chart on Black Grid Background
Green Financial Graphs Overlay in Data Center Environment
Premium
Ascending Green Arrow Graph: Growth, Progress, and Positive Trend on White Background
Rising Green Line on Financial Bar Graph
Binary Code with Downward Graph Over Dark Background
Green Financial Graph Overlaying Urban Cityscape
Green Bar and Line Graph on Dark Interface
Premium
Showing interface over misty skyline with bar line pie charts percentages TESTING PR2 binary digits
Digital Financial Data and Network Connections Visual
Dynamic Financial Data with Fluctuating Stock Market Trends
Dynamic Financial Graph with Bar Chart on Digital Grid
Dynamic Financial Graphs on Gradient Red Background
Premium
Financial growth concept represented by a green neon line graph
Data Analysis with Virus Cells: Global Digital Interface Display
Green Bar and Line Chart with Coding Overlay on Dark Grid
Urban Skyline with Financial Graph Overlay in Red Tones
Dynamic Red Chart Displaying Global Financial Trends
Red Graph Falling over Black and White Office Background
Financial Growth Chart Overlaying Industrial Waste Site
Premium
A 3D bar chart with green bars shows an upward trend, indicated by a jagged green line and an arrow, against a dark background with blue glowing orbs.
Analyzing Network Connections Over Financial Data
Rising Green Line Graph on Abstract Digital Network Background
Dynamic Financial Data Display with Declining Graph Visualization
Green Line Graph on Bar Chart Representing Financial Growth
Premium
A young green plant with visible roots growing in soil, superimposed on a background of upward-trending bar and line graphs, symbolizing growth and development.
Abstract Economic Trends with Graph Overlay on Cityscape
Digital Data Analysis with Graph Overlapping Computer Servers
Green Bar Chart and Line Graph Overlay on Cityscape at Night
Data Analytics Trends Amid Virus Cells Imposing Uncertainty
Premium
green arrow graph stock market growth up trend concept of business growth stock market profit Stock Illustration
Green Graph Overlay with Business Reflection and Network Analysis
Dynamic Green Bar Graph with Rising Line in Digital Art Style
Digital Stock Market Data Visualization Concept
Financial Market Data with Green Line Graph
Premium
Abstract illustration of a colorful graph with bars and a line.
Binary Code Overlaying Red Financial Graph Indicating Market Decline Performance
Financial Data Visualization Over Globe with Grid Background
Dynamic Red Graph Displaying Economic Fluctuations Over Cityscape
Digital Financial Data Visualization Concept with Chart Overlay
Premium
A financial growth chart with a rising line graph, dollar coin, percentage symbol, and green plants, symbolizing business success and investment.
Financial Data Analysis in Server Environment
Dynamic Financial Data Graph on Gray Background
Abstract Financial Graphs with Red Trend Lines
Happy Birthday Text with Economic Graph Backdrop
Premium
Modern portable computer displays rising bar and line chart demonstrating financial progress
Green 3D Bar Graph with Line in Digital Analytics Interface
Interactive dashboard callout displaying 95 messages over 3D green bar chart and polyline
Rising Green Bar Graph with Digital Grid Background
Dynamic Bar Graph with Green Data Line on Digital Interface
Declining Financial Chart with Red Bars and Graph Line
Fluctuating Financial Chart with Red Graph Bars
Premium
A stylized illustration depicting a bar chart with a rising line graph, surrounded by potted plants and grass. The chart bars are white and increase in height f
Financial Charts Overlapping Urban Skyline with Digital Interface
Red Economy Chart Displays Market Downturn Digital Background
Financial Data Analysis with Downward Graph Overlay
Financial and Chemical Structural Analysis Overlaid on Digital Interface
Premium
Dynamic blue and green digital stock market graph faceless financial data defocused dark background bar charts and lines representing analysis investment trends business grow
Dynamic Business Analytics and Data Processing Visualization
Financial Market Trends with Green Bar Graph and Fluctuating Line
Green Bar Graph with Fluctuating Line Chart Depicting Financial Analysis
Financial Data Analytics with Digital Graph Projection
Premium
Hand holding a glowing 3d bar graph with an upward trending line showing financial growth and success
Digital Interface Displaying Statistical Data Trends
Digital Economic Downturn Graph Over Purple Background
Global Business Growth Concept with Green Financial Line Graph
Financial Data Analysis with Green Line Graph on Blue Background
Premium
Futuristic glowing bar graph showing upward financial trend with data lines
Digital Green Bar Graph Over Dark Background Illustrating Market Trends
Green Economic Growth Overlay on Cityscape
Fluctuating Finance Chart with Company Percentages and Abbreviations
Dynamic Financial Statistics with Cityscape Overlay
Premium
Dynamic financial chart with upward trend symbolizing stock market growth, investment success, and economic progress in a visually engaging representation
Dynamic Bar and Line Graph for Data Analytics Visualization
Green Line Graph with Vertical Bars for Data Analysis
Integrating Lifestyle with Data Analytics Conceptual Visualization
Financial Growth Chart Overlay on Urban Cityscape
Premium
Neon blue bar graph with green line chart and year 2026 overlay image
Red Market Downtrend Showing 3D Bar Chart with Jagged Line and Glowing BUY Letters