- Home >
- Stock Photos >
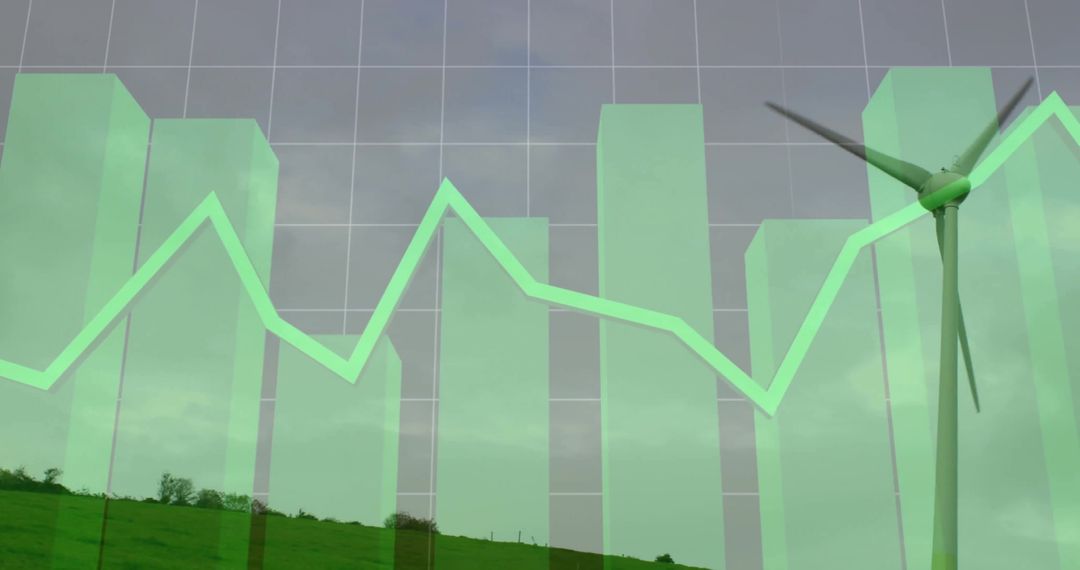
- Green Bar Chart and Line Graph Overlay on Cityscape at Night
Green Bar Chart and Line Graph Overlay on Cityscape at Night Image

A bar chart in vivid green overlays a nighttime city, highlighting financial volatility and market changes. Suitable for illustrating technical advancements in data analytics and business insights, ideal for editorial use on finance or tech-driven websites.
Powered by  - Get 15% off with code: PIKWIZARD15


2
downloads
downloads
Tags:
More
Credit Photo
If you would like to credit the Photo, here are some ways you can do so
Text Link
photo Link
<span class="text-link">
<span>
<a target="_blank" href=https://pikwizard.com/photo/green-bar-chart-and-line-graph-overlay-on-cityscape-at-night/b4a547052ad9aaa9322c7ad7db69e5e6/>PikWizard</a>
</span>
</span>
<span class="image-link">
<span
style="margin: 0 0 20px 0; display: inline-block; vertical-align: middle; width: 100%;"
>
<a
target="_blank"
href="https://pikwizard.com/photo/green-bar-chart-and-line-graph-overlay-on-cityscape-at-night/b4a547052ad9aaa9322c7ad7db69e5e6/"
style="text-decoration: none; font-size: 10px; margin: 0;"
>
<img src="https://pikwizard.com/pw/medium/b4a547052ad9aaa9322c7ad7db69e5e6.jpg" style="margin: 0; width: 100%;" alt="" />
<p style="font-size: 12px; margin: 0;">PikWizard</p>
</a>
</span>
</span>
Free (free of charge)
Free for personal and commercial use.
Author: Awesome Content
Similar Free Stock Images