
- Home >
- Stock Photos >
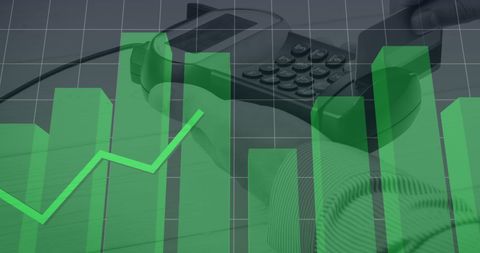
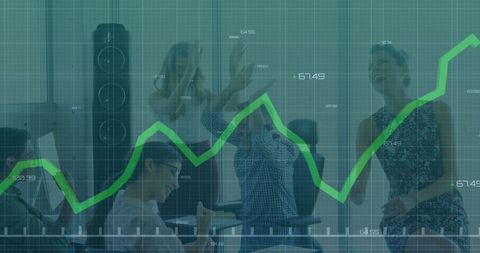
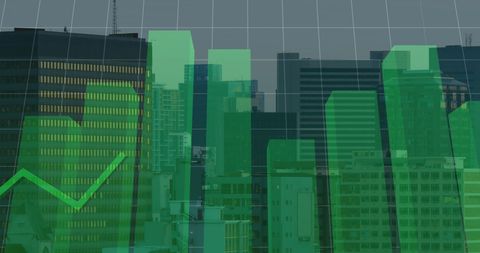
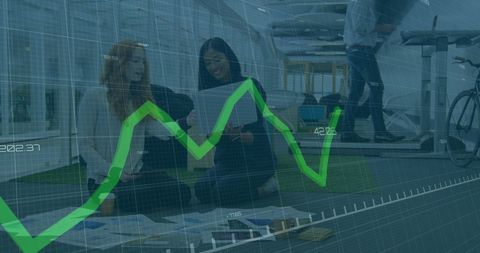
- Green Bar Graph Overlapped with Reflection of Businessperson in Conference Room
Green Bar Graph Overlapped with Reflection of Businessperson in Conference Room Image
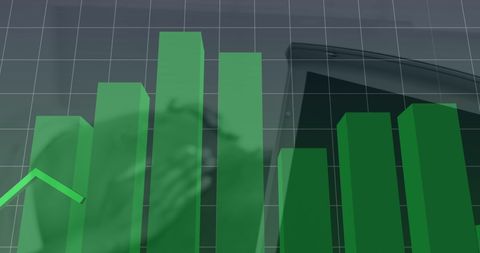
Perfect for business reports or financial presentations, this image of a reflective bar graph is suggestive of economic growth and strategic planning. Use it for conveying data results in a sophisticated, professional manner indicative of upward trends in finance and business.
Powered by  - Get 15% off with code: PIKWIZARD15


4
downloads
downloads
Tags:
More
Credit Photo
If you would like to credit the Photo, here are some ways you can do so
Text Link
photo Link
<span class="text-link">
<span>
<a target="_blank" href=https://pikwizard.com/photo/green-bar-graph-overlapped-with-reflection-of-businessperson-in-conference-room/23cc43b20382a2fa03b3605b2366be85/>PikWizard</a>
</span>
</span>
<span class="image-link">
<span
style="margin: 0 0 20px 0; display: inline-block; vertical-align: middle; width: 100%;"
>
<a
target="_blank"
href="https://pikwizard.com/photo/green-bar-graph-overlapped-with-reflection-of-businessperson-in-conference-room/23cc43b20382a2fa03b3605b2366be85/"
style="text-decoration: none; font-size: 10px; margin: 0;"
>
<img src="https://pikwizard.com/pw/medium/23cc43b20382a2fa03b3605b2366be85.jpg" style="margin: 0; width: 100%;" alt="" />
<p style="font-size: 12px; margin: 0;">PikWizard</p>
</a>
</span>
</span>
Free (free of charge)
Free for personal and commercial use.
Author: Awesome Content
Similar Free Stock Images
Loading...

Premium


Premium

Premium


Premium


Premium


Premium


Premium


Premium


Premium

Premium

Premium

Premium


Premium

Premium


Premium

Premium

Premium


Premium

Premium


Premium


Premium

Premium


Premium


Premium

Premium
