- Home >
- Stock Photos >
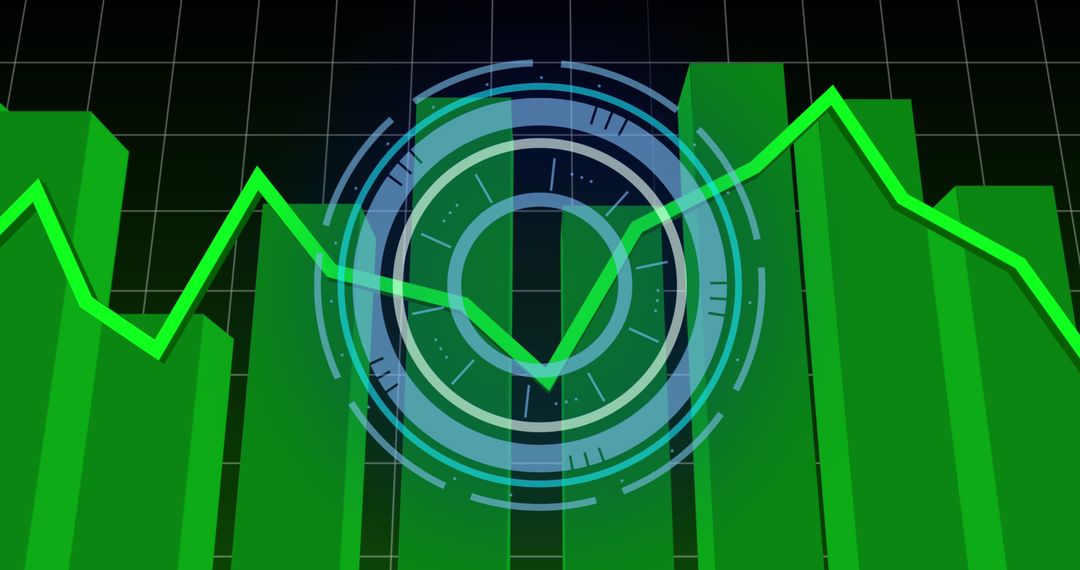
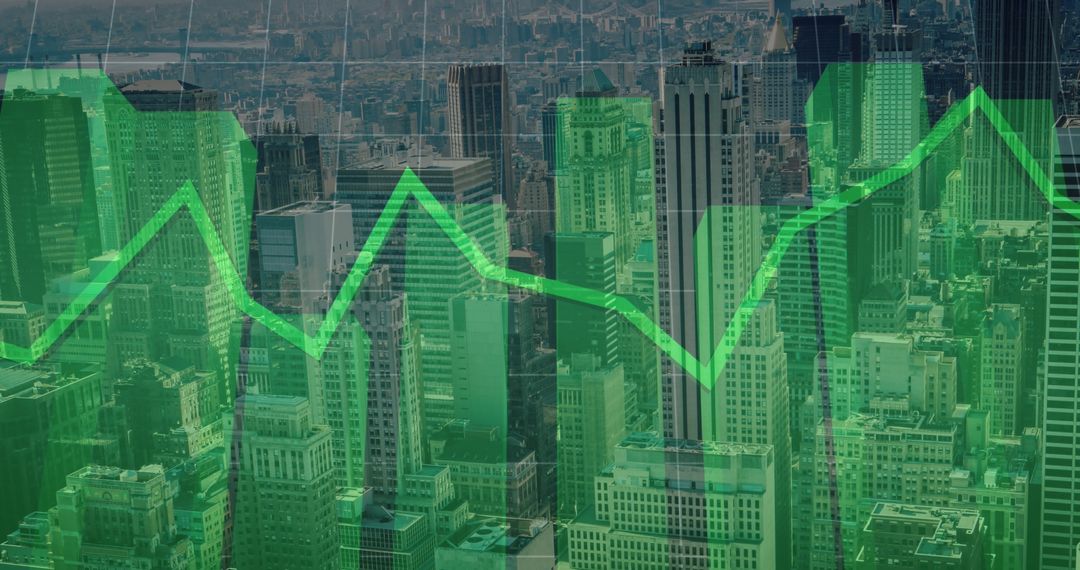
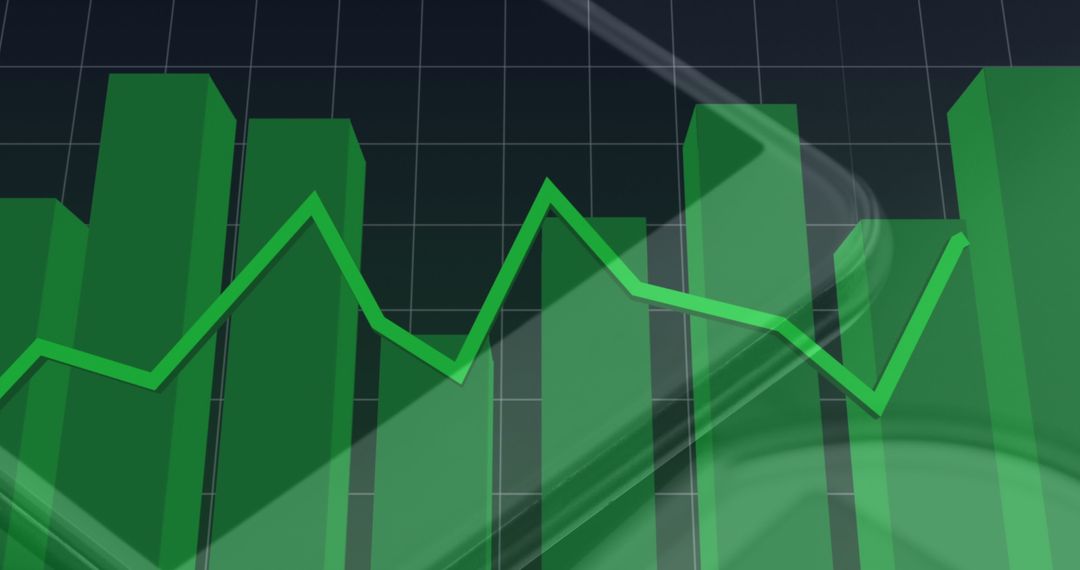
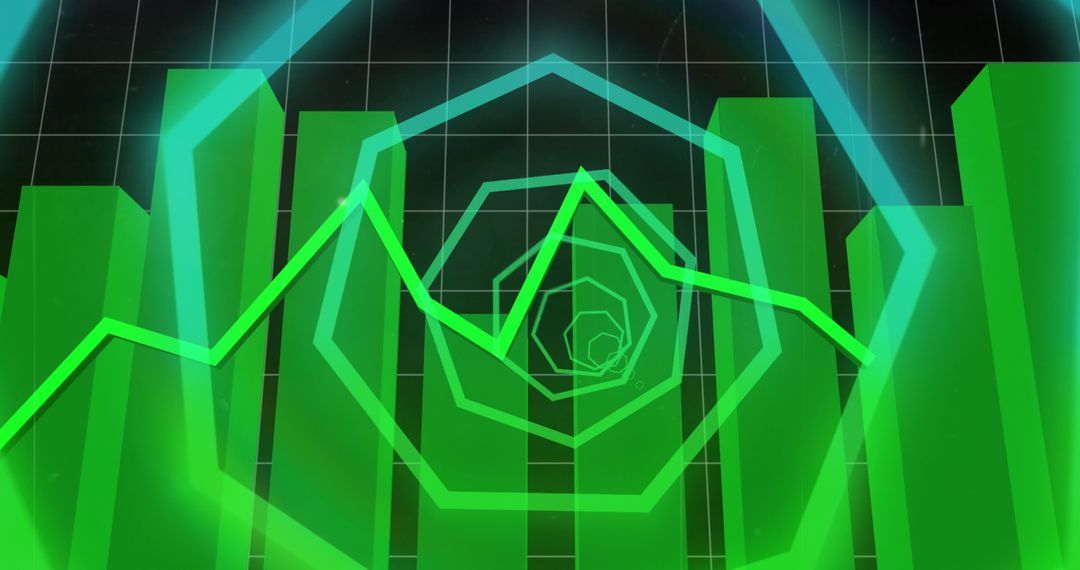
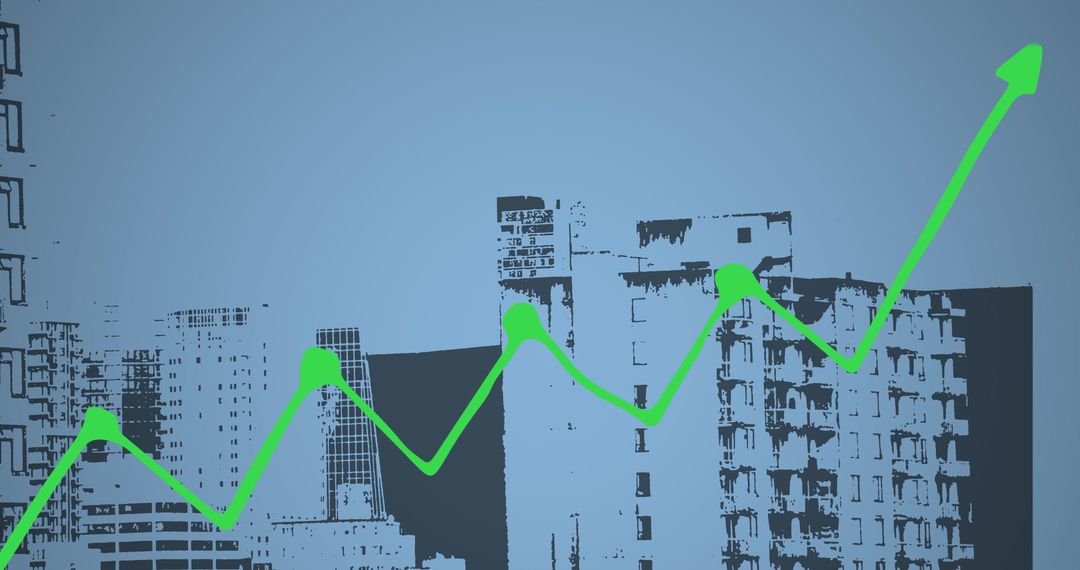
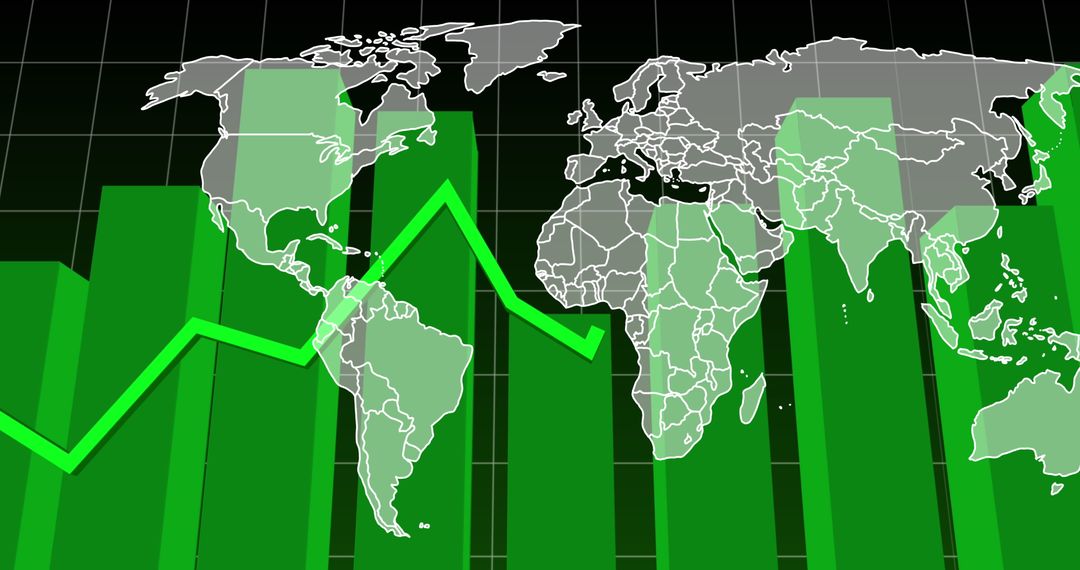
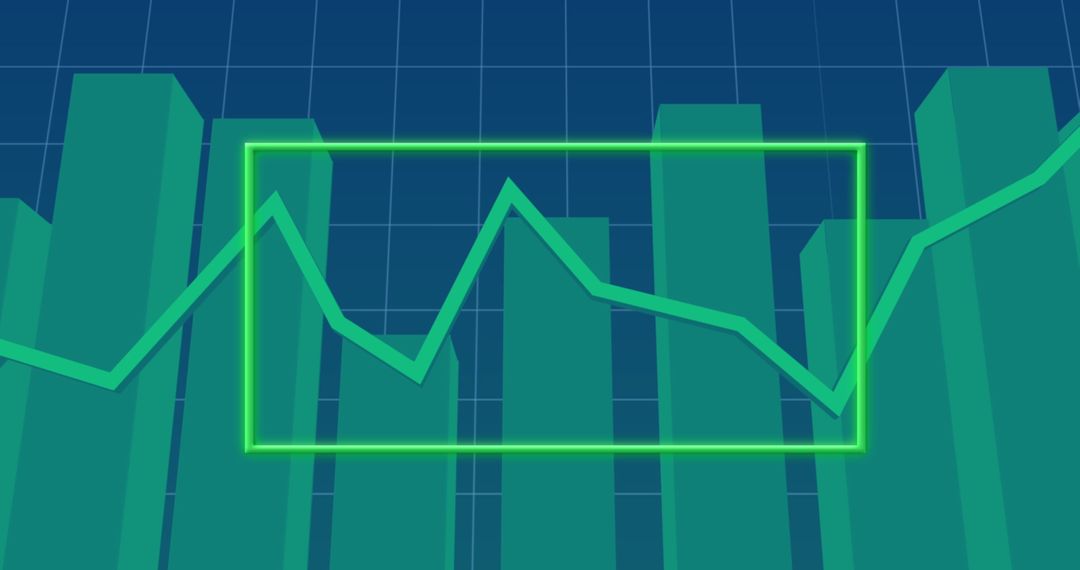
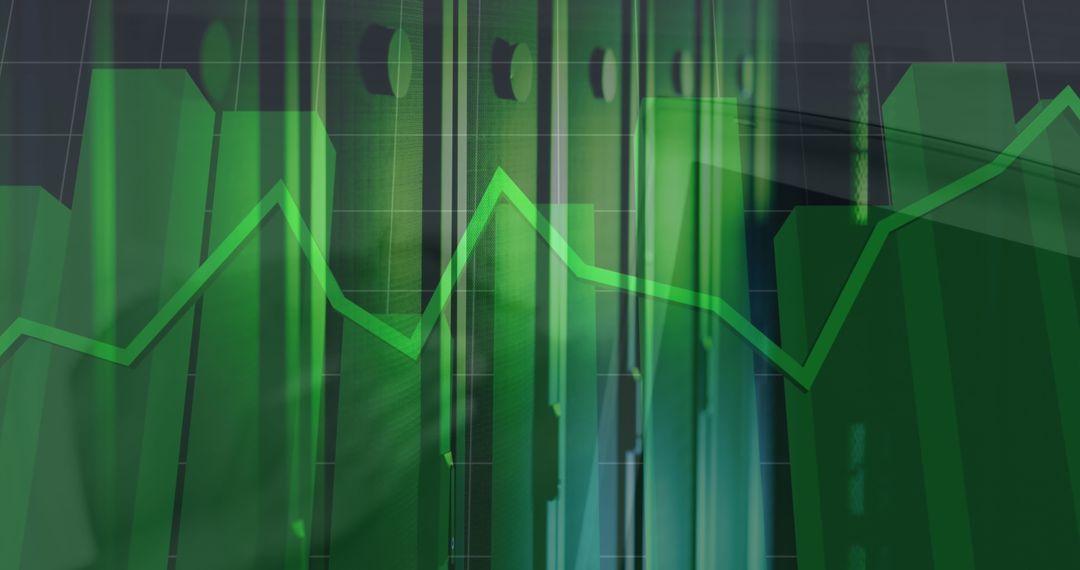
- Green Bar Graph with Fluctuating Line Chart Depicting Financial Analysis
Green Bar Graph with Fluctuating Line Chart Depicting Financial Analysis Image

This dynamic illustration shows a green bar graph with a fluctuating line chart, representing various financial metrics. Suitable for reports, presentations, and articles about finance, investment, economic growth, and data analytics. Useful in conveying complex financial information visually to enhance understanding of market trends and forecasting.
Powered by  - Get 15% off with code: PIKWIZARD15


0
downloads
downloads
Tags:
More
Credit Photo
If you would like to credit the Photo, here are some ways you can do so
Text Link
photo Link
<span class="text-link">
<span>
<a target="_blank" href=https://pikwizard.com/photo/green-bar-graph-with-fluctuating-line-chart-depicting-financial-analysis/fe051c44d18a143d4f87ba6daf01605b/>PikWizard</a>
</span>
</span>
<span class="image-link">
<span
style="margin: 0 0 20px 0; display: inline-block; vertical-align: middle; width: 100%;"
>
<a
target="_blank"
href="https://pikwizard.com/photo/green-bar-graph-with-fluctuating-line-chart-depicting-financial-analysis/fe051c44d18a143d4f87ba6daf01605b/"
style="text-decoration: none; font-size: 10px; margin: 0;"
>
<img src="https://pikwizard.com/pw/medium/fe051c44d18a143d4f87ba6daf01605b.jpg" style="margin: 0; width: 100%;" alt="" />
<p style="font-size: 12px; margin: 0;">PikWizard</p>
</a>
</span>
</span>
Free (free of charge)
Free for personal and commercial use.
Author: People Creations
Similar Free Stock Images

Premium


Premium


Premium


Premium


Premium


Premium


Premium


Premium


Premium


Premium


Premium


Premium


Premium


Premium


Premium


Premium


Premium


Premium


Premium


Premium


Premium


Premium


Premium


Premium