
- Home >
- Stock Photos >
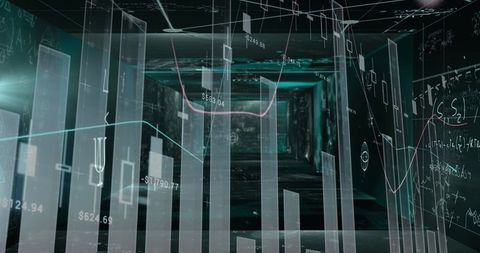
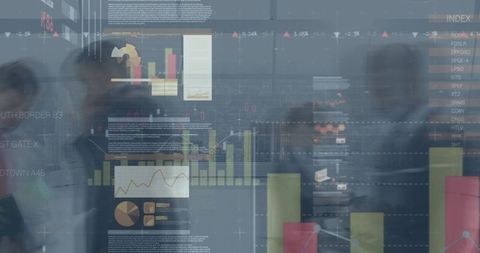
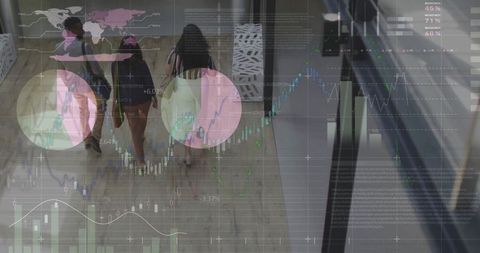
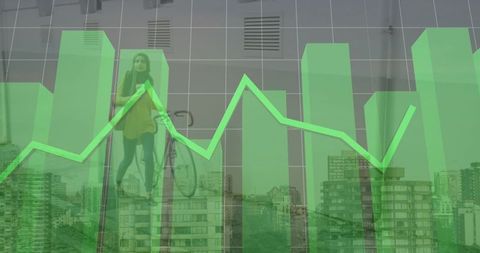
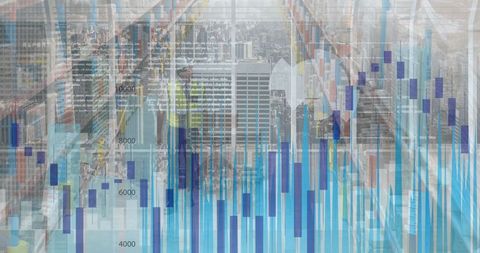
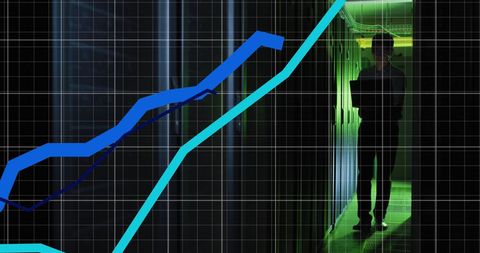
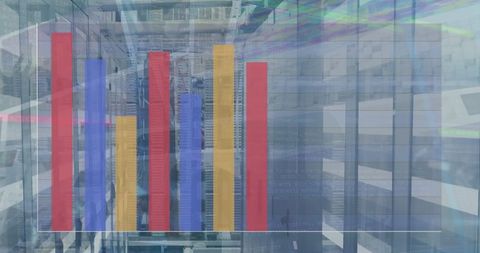
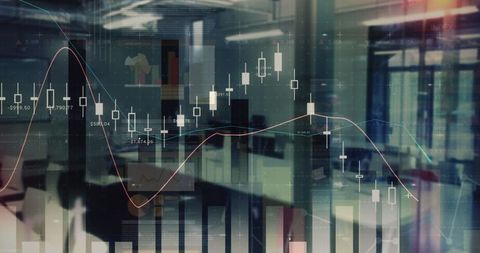
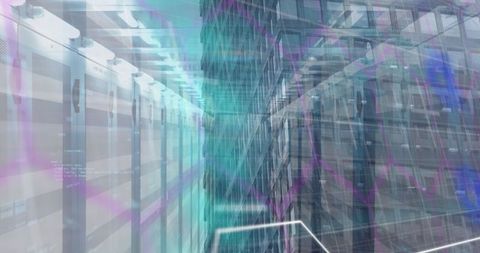
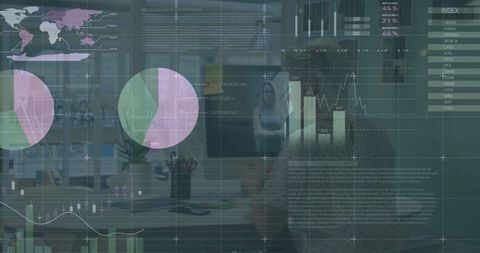
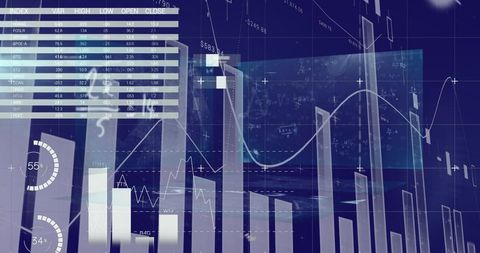
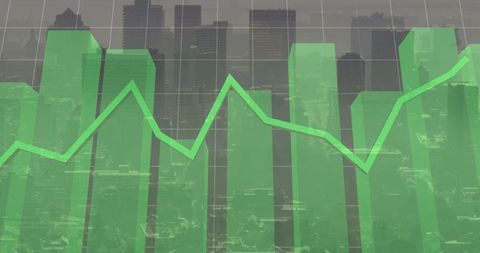
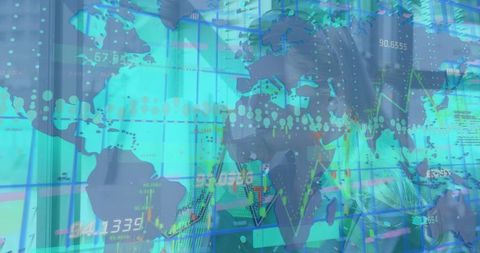
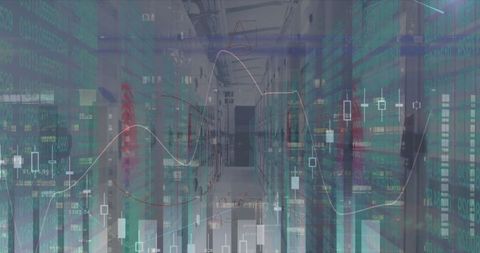
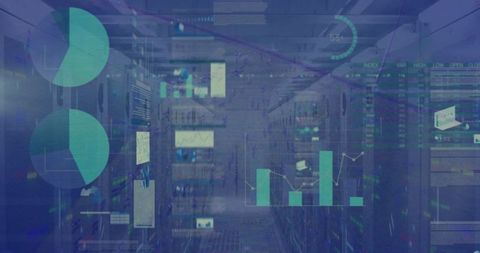
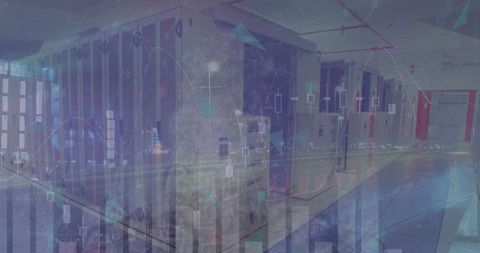
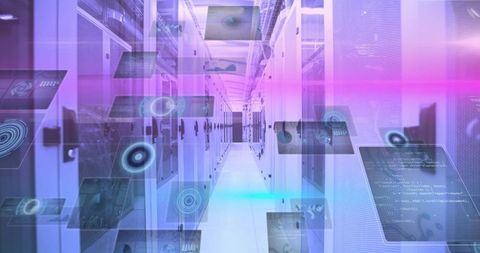
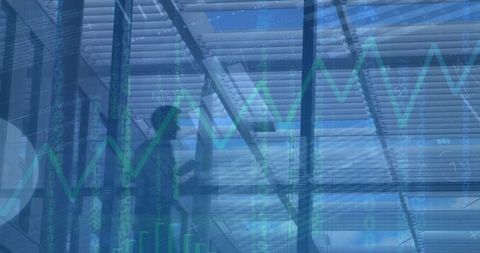
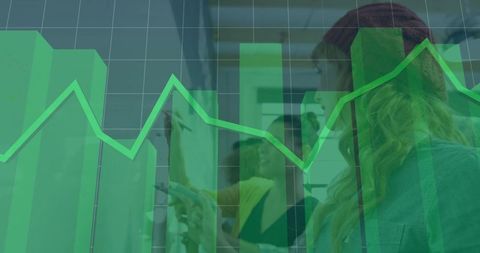
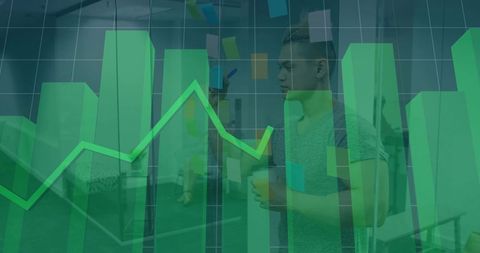
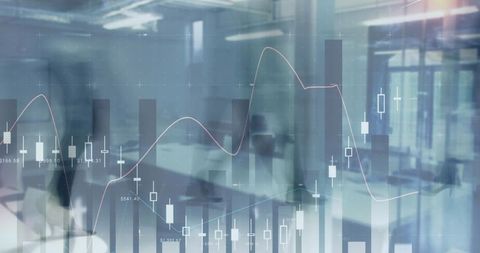
- Green Bar Graphs Over Networking Server Infrastructure
Green Bar Graphs Over Networking Server Infrastructure Image
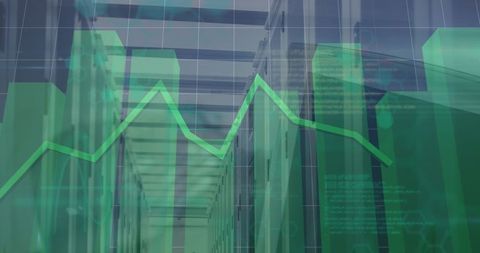
Digital comparison of a bar graph and server room symbolizes intersection of technology and financial data analysis. Excellent for articles or presentations on investment strategies, digital currencies, blockchain technology, green economy, or technological advancements in trade industries.
Powered by 


downloads
Tags:
More
Credit Photo
If you would like to credit the Photo, here are some ways you can do so
Text Link
photo Link
<span class="text-link">
<span>
<a target="_blank" href=https://pikwizard.com/photo/green-bar-graphs-over-networking-server-infrastructure/bdaa93401b2f91b903c66b1c32af72c2/>PikWizard</a>
</span>
</span>
<span class="image-link">
<span
style="margin: 0 0 20px 0; display: inline-block; vertical-align: middle; width: 100%;"
>
<a
target="_blank"
href="https://pikwizard.com/photo/green-bar-graphs-over-networking-server-infrastructure/bdaa93401b2f91b903c66b1c32af72c2/"
style="text-decoration: none; font-size: 10px; margin: 0;"
>
<img src="https://pikwizard.com/pw/medium/bdaa93401b2f91b903c66b1c32af72c2.jpg" style="margin: 0; width: 100%;" alt="" />
<p style="font-size: 12px; margin: 0;">PikWizard</p>
</a>
</span>
</span>
Free (free of charge)
Free for personal and commercial use.
Author: Creative Art
Similar Free Stock Images
Premium

Premium

Premium


Premium


Premium


Premium


Premium


Premium

Premium

Premium

Premium


Premium


Premium

Premium

Premium


Premium

Premium


Premium


Premium


Premium


Premium


Premium


Premium


Premium

Premium


Explore More Free Stock Images