- Home >
- Stock Photos >
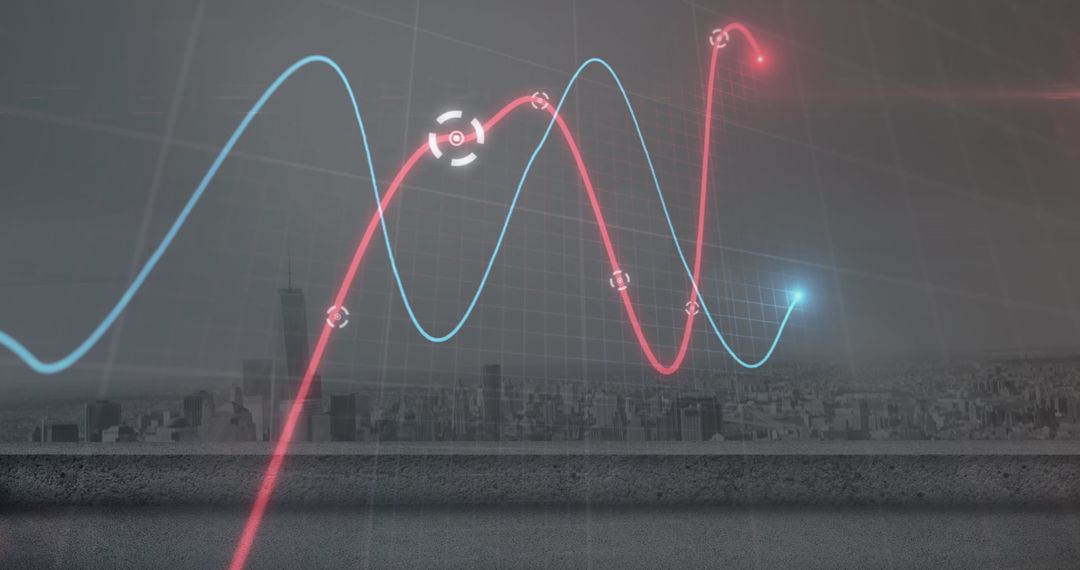
- Green Digital Graphs in Modern Business Environment
Green Digital Graphs in Modern Business Environment Image
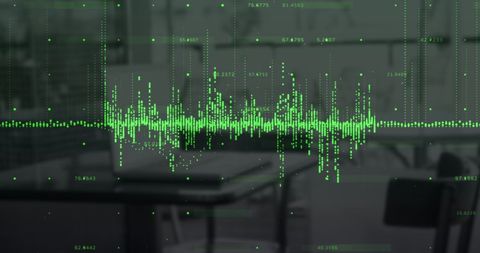
This image features dynamic green digital graphs overlaid on an empty office environment, symbolizing the concept of data processing and analysis in personal finance and corporate business settings. It is perfect for use in materials related to finance technology innovations, data-driven decision making, business presentations, and social media posts around the theme of financial growth and market analysis.
Powered by 


2
downloads
downloads
Tags:
More
Credit Photo
If you would like to credit the Photo, here are some ways you can do so
Text Link
photo Link
<span class="text-link">
<span>
<a target="_blank" href=https://pikwizard.com/photo/green-digital-graphs-in-modern-business-environment/7ebdb85c623b8e12a4a8e0b2258d1501/>PikWizard</a>
</span>
</span>
<span class="image-link">
<span
style="margin: 0 0 20px 0; display: inline-block; vertical-align: middle; width: 100%;"
>
<a
target="_blank"
href="https://pikwizard.com/photo/green-digital-graphs-in-modern-business-environment/7ebdb85c623b8e12a4a8e0b2258d1501/"
style="text-decoration: none; font-size: 10px; margin: 0;"
>
<img src="https://pikwizard.com/pw/medium/7ebdb85c623b8e12a4a8e0b2258d1501.jpg" style="margin: 0; width: 100%;" alt="" />
<p style="font-size: 12px; margin: 0;">PikWizard</p>
</a>
</span>
</span>
Free (free of charge)
Free for personal and commercial use.
Author: Creative Art
Similar Free Stock Images

Premium


Premium


Premium


Premium


Premium


Premium


Premium


Premium


Premium


Premium


Premium


Premium


Premium


Premium


Premium


Premium


Premium


Premium


Premium


Premium


Premium


Premium


Premium


Premium