
- Home >
- Stock Photos >
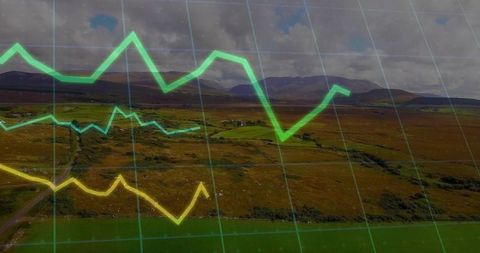
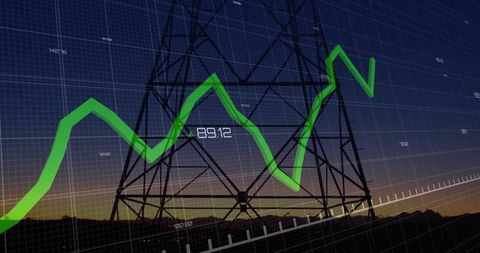
- Green Financial Chart with Upward Trend Line Spikes Dramatically
Green Financial Chart with Upward Trend Line Spikes Dramatically Image

Depiction of financial chart with green line showing a marked upward trend on grid background. Represents concepts of economic growth, positive market trends, and profitability. Ideal for use in presentations, financial news, and business websites to emphasize potential success or underscore analytical reports.
Powered by 


downloads
Tags:
More
Credit Photo
If you would like to credit the Photo, here are some ways you can do so
Text Link
photo Link
<span class="text-link">
<span>
<a target="_blank" href=https://pikwizard.com/photo/green-financial-chart-with-upward-trend-line-spikes-dramatically/62c54b12841e302fc2e81dd013a90b26/>PikWizard</a>
</span>
</span>
<span class="image-link">
<span
style="margin: 0 0 20px 0; display: inline-block; vertical-align: middle; width: 100%;"
>
<a
target="_blank"
href="https://pikwizard.com/photo/green-financial-chart-with-upward-trend-line-spikes-dramatically/62c54b12841e302fc2e81dd013a90b26/"
style="text-decoration: none; font-size: 10px; margin: 0;"
>
<img src="https://pikwizard.com/pw/medium/62c54b12841e302fc2e81dd013a90b26.jpg" style="margin: 0; width: 100%;" alt="" />
<p style="font-size: 12px; margin: 0;">PikWizard</p>
</a>
</span>
</span>
Free (free of charge)
Free for personal and commercial use.
Author: Creative Art
Similar Free Stock Images
Loading...

Premium


Premium


Premium

Premium


Premium


Premium


Premium

Premium


Premium


Premium


Premium


Premium

Premium


Premium

Premium


Premium


Premium

Premium


Premium


Premium


Premium


Premium


Premium

Premium

Premium


Explore More Free Stock Images