
- Home >
- Stock Photos >
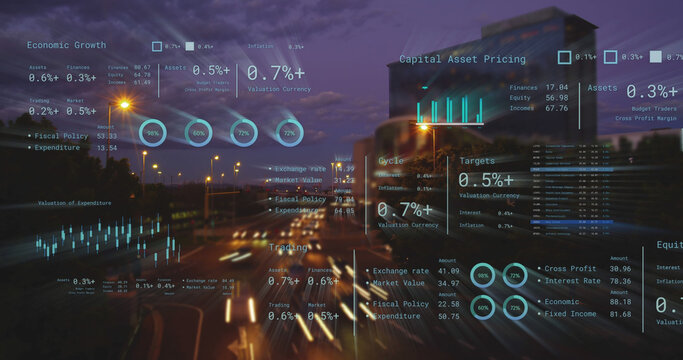
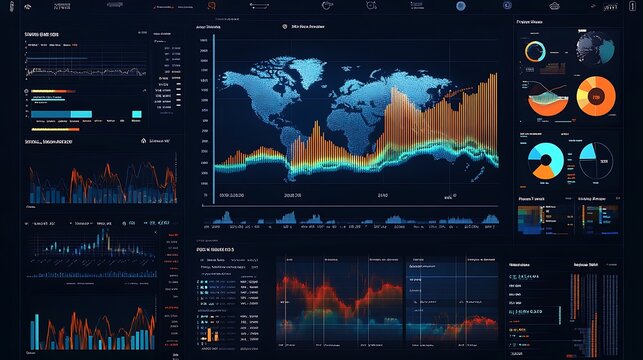
- Green Financial Data and Global Analysis Concept
Green Financial Data and Global Analysis Concept Image

Graphic shows green linear trajectory line with grid backdrop, symbolizing financial growth, market changes, investment strategies. Useful for presentations, business reports, financial news, online articles on economics and trends.
Powered by 


downloads
Tags:
More
Credit Photo
If you would like to credit the Photo, here are some ways you can do so
Text Link
photo Link
<span class="text-link">
<span>
<a target="_blank" href=https://pikwizard.com/photo/green-financial-data-and-global-analysis-concept/be8d4ddf53fffdcb5fbc78ef284eb07c/>PikWizard</a>
</span>
</span>
<span class="image-link">
<span
style="margin: 0 0 20px 0; display: inline-block; vertical-align: middle; width: 100%;"
>
<a
target="_blank"
href="https://pikwizard.com/photo/green-financial-data-and-global-analysis-concept/be8d4ddf53fffdcb5fbc78ef284eb07c/"
style="text-decoration: none; font-size: 10px; margin: 0;"
>
<img src="https://pikwizard.com/pw/medium/be8d4ddf53fffdcb5fbc78ef284eb07c.jpg" style="margin: 0; width: 100%;" alt="" />
<p style="font-size: 12px; margin: 0;">PikWizard</p>
</a>
</span>
</span>
Free (free of charge)
Free for personal and commercial use.
Author: Creative Art
Similar Free Stock Images

Premium


Premium

Premium


Premium


Premium


Premium


Premium


Premium


Premium


Premium


Premium


Premium


Premium


Premium


Premium


Premium


Premium


Premium


Premium


Premium


Premium


Premium


Premium


Premium


Premium


Explore More Free Stock Images