
- Home >
- Stock Photos >
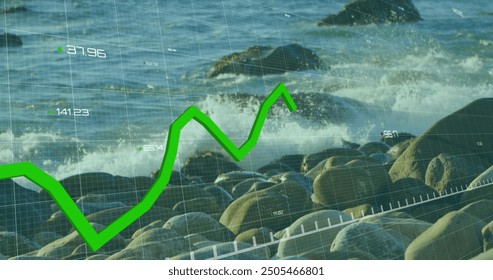
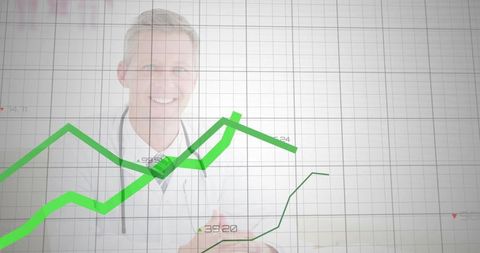
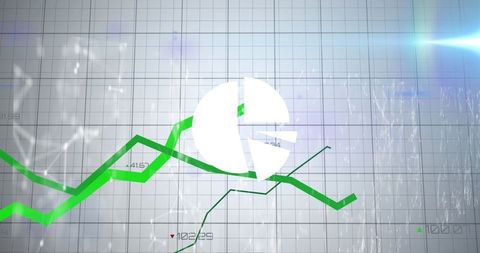
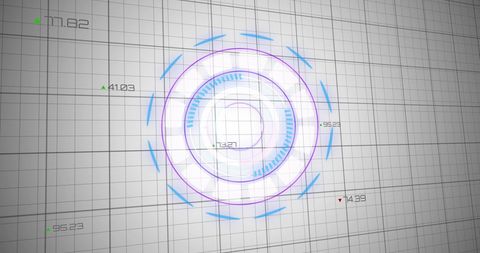
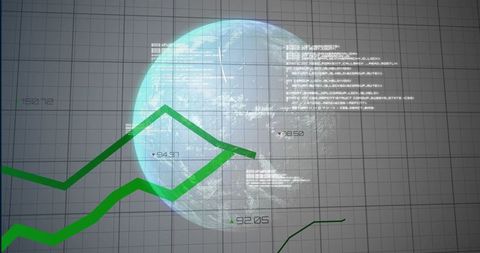
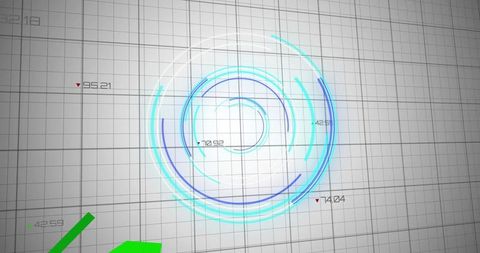
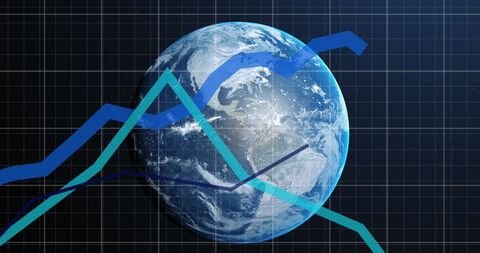
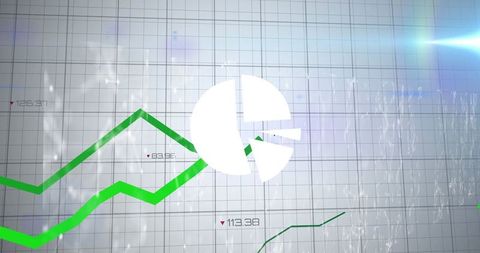
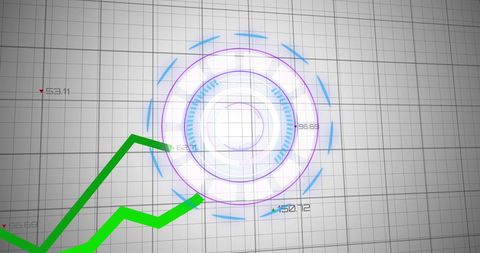
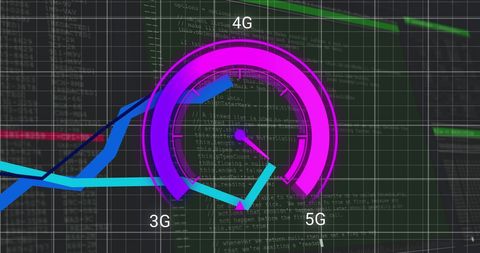
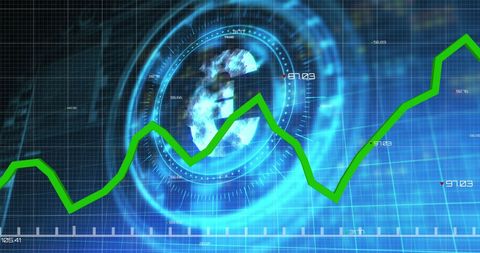
- Green Financial Graph with Futuristic Clock Interface
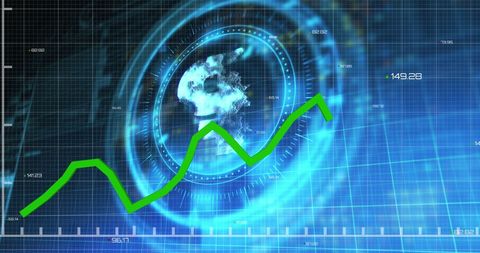
Green Financial Graph with Futuristic Clock Interface Image

Depicts a vibrant green financial graph overlaid with a futuristic clock interface, symbolizing dynamic business growth and evolving market indices. Useful for highlighting trends in financial analytics, global investments, and cryptocurrency fluctuations. Ideal for presentations, business articles, or reports exploring innovative approaches in finance management.
Powered by  - Get 15% off with code: PIKWIZARD15


downloads
Tags:
More
Credit Photo
If you would like to credit the Photo, here are some ways you can do so
Text Link
photo Link
<span class="text-link">
<span>
<a target="_blank" href=https://pikwizard.com/photo/green-financial-graph-with-futuristic-clock-interface/b985ceadff57fca273700e258ecaa4e6/>PikWizard</a>
</span>
</span>
<span class="image-link">
<span
style="margin: 0 0 20px 0; display: inline-block; vertical-align: middle; width: 100%;"
>
<a
target="_blank"
href="https://pikwizard.com/photo/green-financial-graph-with-futuristic-clock-interface/b985ceadff57fca273700e258ecaa4e6/"
style="text-decoration: none; font-size: 10px; margin: 0;"
>
<img src="https://pikwizard.com/pw/medium/b985ceadff57fca273700e258ecaa4e6.jpg" style="margin: 0; width: 100%;" alt="" />
<p style="font-size: 12px; margin: 0;">PikWizard</p>
</a>
</span>
</span>
Free (free of charge)
Free for personal and commercial use.
Author: Authentic Images
Similar Free Stock Images
Premium


Premium


Premium


Premium


Premium


Premium


Premium

Premium

Premium


Premium


Premium


Premium

Premium

Premium


Premium


Premium


Premium


Premium


Premium


Premium


Premium


Premium


Premium


Premium


Premium


Explore More Free Stock Images